Data
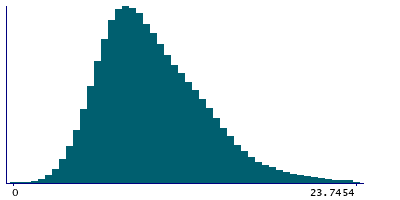
457,927 items of data are available, covering 210,739 participants.
Defined-instances run from 0 to 4, labelled using Instancing
1.
Units of measurement are mg.
| Maximum | 89.498 |
| Decile 9 | 14.624 |
| Decile 8 | 12.6351 |
| Decile 7 | 11.2416 |
| Decile 6 | 10.102 |
| Median | 9.13673 |
| Decile 4 | 8.28246 |
| Decile 3 | 7.45832 |
| Decile 2 | 6.60014 |
| Decile 1 | 5.50237 |
| Minimum | 0 |
|
|
- Mean = 9.74067
- Std.dev = 3.85747
- 2320 items above graph maximum of 23.7457
|
5 Instances
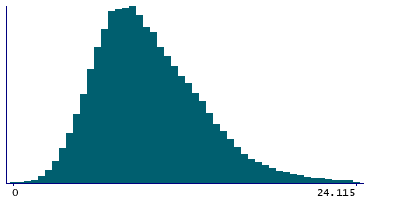
Instance 0 : Conducted in assessment centre, April 2009 to September 2010.
70,630 participants, 70,630 items
| Maximum | 87.2522 |
| Decile 9 | 14.6807 |
| Decile 8 | 12.6071 |
| Decile 7 | 11.1833 |
| Decile 6 | 10.0184 |
| Median | 9.03756 |
| Decile 4 | 8.16469 |
| Decile 3 | 7.29179 |
| Decile 2 | 6.39511 |
| Decile 1 | 5.24626 |
| Minimum | 0 |
|
|
- Mean = 9.64852
- Std.dev = 4.0263
- 390 items above graph maximum of 24.1151
|
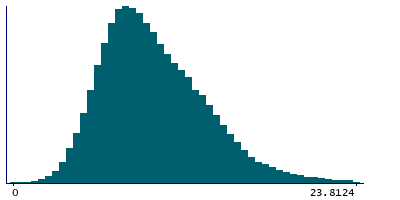
Instance 1 : On-line cycle 1, February 2011 to April 2011.
100,447 participants, 100,447 items
| Maximum | 73.6428 |
| Decile 9 | 14.7129 |
| Decile 8 | 12.7734 |
| Decile 7 | 11.3829 |
| Decile 6 | 10.2396 |
| Median | 9.25547 |
| Decile 4 | 8.38887 |
| Decile 3 | 7.56859 |
| Decile 2 | 6.71306 |
| Decile 1 | 5.61235 |
| Minimum | 0 |
|
|
- Mean = 9.84641
- Std.dev = 3.81919
- 457 items above graph maximum of 23.8136
|
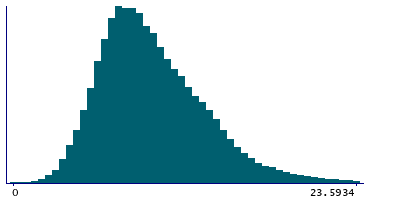
Instance 2 : On-line cycle 2, June 2011 to September 2011.
83,140 participants, 83,140 items
| Maximum | 89.498 |
| Decile 9 | 14.5299 |
| Decile 8 | 12.5234 |
| Decile 7 | 11.1088 |
| Decile 6 | 9.97037 |
| Median | 9.02524 |
| Decile 4 | 8.1906 |
| Decile 3 | 7.37494 |
| Decile 2 | 6.5433 |
| Decile 1 | 5.46518 |
| Minimum | 0 |
|
|
- Mean = 9.66066
- Std.dev = 3.86265
- 451 items above graph maximum of 23.5947
|
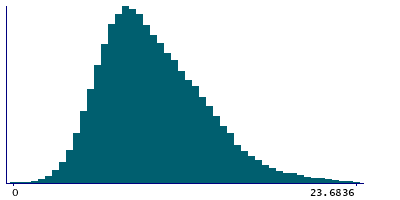
Instance 3 : On-line cycle 3, October 2011 to December 2011.
103,616 participants, 103,616 items
| Maximum | 69.0729 |
| Decile 9 | 14.6255 |
| Decile 8 | 12.676 |
| Decile 7 | 11.3084 |
| Decile 6 | 10.1893 |
| Median | 9.21185 |
| Decile 4 | 8.35071 |
| Decile 3 | 7.52605 |
| Decile 2 | 6.66236 |
| Decile 1 | 5.56686 |
| Minimum | 0 |
|
|
- Mean = 9.78771
- Std.dev = 3.79654
- 488 items above graph maximum of 23.6841
|
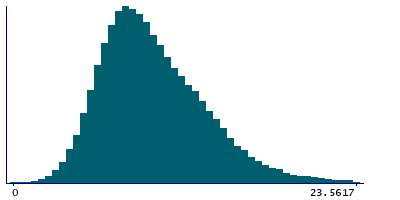
Instance 4 : On-line cycle 4, April 2012 to June 2012.
100,094 participants, 100,094 items
| Maximum | 76.3148 |
| Decile 9 | 14.5521 |
| Decile 8 | 12.5723 |
| Decile 7 | 11.1694 |
| Decile 6 | 10.0456 |
| Median | 9.09997 |
| Decile 4 | 8.2627 |
| Decile 3 | 7.46132 |
| Decile 2 | 6.61304 |
| Decile 1 | 5.54523 |
| Minimum | 0 |
|
|
- Mean = 9.71736
- Std.dev = 3.82885
- 533 items above graph maximum of 23.559
|


