Data
457,927 items of data are available, covering 210,739 participants.
Defined-instances run from 0 to 4, labelled using Instancing
1.
Units of measurement are ug.
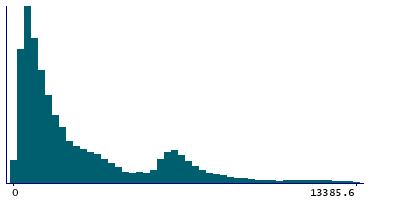
| Maximum | 55409.2 |
| Decile 9 | 7083.23 |
| Decile 8 | 5808.36 |
| Decile 7 | 3407.94 |
| Decile 6 | 2287.68 |
| Median | 1587.46 |
| Decile 4 | 1139.45 |
| Decile 3 | 825.36 |
| Decile 2 | 580.374 |
| Decile 1 | 373.721 |
| Minimum | 0 |
|

|
- Mean = 2968.63
- Std.dev = 3303.9
- 5914 items above graph maximum of 13792.7
|
5 Instances
Instance 0 : Conducted in assessment centre, April 2009 to September 2010.
70,630 participants, 70,630 items
| Maximum | 46677.8 |
| Decile 9 | 7353.38 |
| Decile 8 | 5957.19 |
| Decile 7 | 3508.82 |
| Decile 6 | 2308.01 |
| Median | 1527.25 |
| Decile 4 | 1075.88 |
| Decile 3 | 758.46 |
| Decile 2 | 520.407 |
| Decile 1 | 331.384 |
| Minimum | 0 |
|
|
- Mean = 3036.97
- Std.dev = 3480.84
- 952 items above graph maximum of 14375.4
|
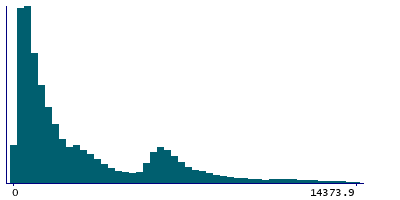
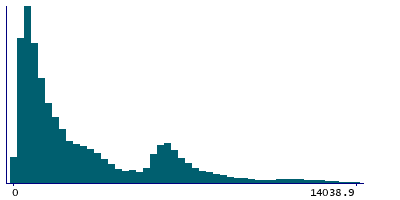
Instance 1 : On-line cycle 1, February 2011 to April 2011.
100,447 participants, 100,447 items
| Maximum | 55409.2 |
| Decile 9 | 7212.44 |
| Decile 8 | 5971.47 |
| Decile 7 | 3669.52 |
| Decile 6 | 2483.74 |
| Median | 1694.28 |
| Decile 4 | 1193.75 |
| Decile 3 | 853.696 |
| Decile 2 | 597.031 |
| Decile 1 | 385.983 |
| Minimum | 0 |
|
|
- Mean = 3097.69
- Std.dev = 3400.09
- 1349 items above graph maximum of 14038.9
|
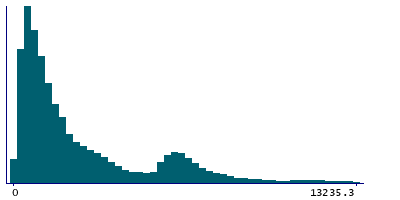
Instance 2 : On-line cycle 2, June 2011 to September 2011.
83,140 participants, 83,140 items
| Maximum | 52027.2 |
| Decile 9 | 6811.38 |
| Decile 8 | 5158.37 |
| Decile 7 | 3039.26 |
| Decile 6 | 2054.09 |
| Median | 1503.76 |
| Decile 4 | 1126.72 |
| Decile 3 | 842.425 |
| Decile 2 | 601.007 |
| Decile 1 | 387.513 |
| Minimum | 0 |
|
|
- Mean = 2763.22
- Std.dev = 3071.65
- 967 items above graph maximum of 13235.2
|
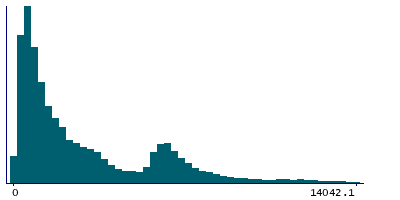
Instance 3 : On-line cycle 3, October 2011 to December 2011.
103,616 participants, 103,616 items
| Maximum | 50349.1 |
| Decile 9 | 7210.17 |
| Decile 8 | 5955.43 |
| Decile 7 | 3675.22 |
| Decile 6 | 2501.1 |
| Median | 1715.28 |
| Decile 4 | 1189.43 |
| Decile 3 | 843.828 |
| Decile 2 | 587.996 |
| Decile 1 | 378.429 |
| Minimum | 0 |
|
|
- Mean = 3096.77
- Std.dev = 3370.68
- 1440 items above graph maximum of 14041.9
|
Instance 4 : On-line cycle 4, April 2012 to June 2012.
100,094 participants, 100,094 items
| Maximum | 54648.4 |
| Decile 9 | 6883.07 |
| Decile 8 | 5534.5 |
| Decile 7 | 3173.96 |
| Decile 6 | 2116.65 |
| Median | 1498.9 |
| Decile 4 | 1101.42 |
| Decile 3 | 811.17 |
| Decile 2 | 581.657 |
| Decile 1 | 379.673 |
| Minimum | 0 |
|
|
- Mean = 2828.87
- Std.dev = 3177.81
- 1196 items above graph maximum of 13386.5
|
