Data
457,927 items of data are available, covering 210,739 participants.
Defined-instances run from 0 to 4, labelled using Instancing
1.
Units of measurement are g.
| Maximum | 23.7716 |
| Decile 9 | 3.63238 |
| Decile 8 | 2.81701 |
| Decile 7 | 2.29807 |
| Decile 6 | 1.96186 |
| Median | 1.70087 |
| Decile 4 | 1.47565 |
| Decile 3 | 1.26669 |
| Decile 2 | 1.05479 |
| Decile 1 | 0.807264 |
| Minimum | 0 |
|

|
- Mean = 2.00013
- Std.dev = 1.2096
- 3192 items above graph maximum of 6.4575
|
5 Instances
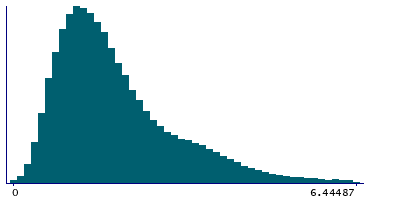
Instance 0 : Conducted in assessment centre, April 2009 to September 2010.
70,630 participants, 70,630 items
| Maximum | 22.1697 |
| Decile 9 | 3.60433 |
| Decile 8 | 2.77796 |
| Decile 7 | 2.2657 |
| Decile 6 | 1.92361 |
| Median | 1.66274 |
| Decile 4 | 1.43556 |
| Decile 3 | 1.22394 |
| Decile 2 | 1.01387 |
| Decile 1 | 0.763808 |
| Minimum | 0 |
|
|
- Mean = 1.96352
- Std.dev = 1.22253
- 507 items above graph maximum of 6.44485
|
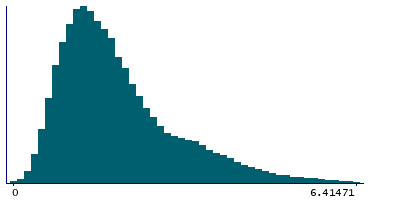
Instance 1 : On-line cycle 1, February 2011 to April 2011.
100,447 participants, 100,447 items
| Maximum | 16.771 |
| Decile 9 | 3.61918 |
| Decile 8 | 2.80235 |
| Decile 7 | 2.29659 |
| Decile 6 | 1.96688 |
| Median | 1.71236 |
| Decile 4 | 1.48742 |
| Decile 3 | 1.28165 |
| Decile 2 | 1.07247 |
| Decile 1 | 0.823472 |
| Minimum | 0 |
|
|
- Mean = 2.00496
- Std.dev = 1.19838
- 730 items above graph maximum of 6.41489
|
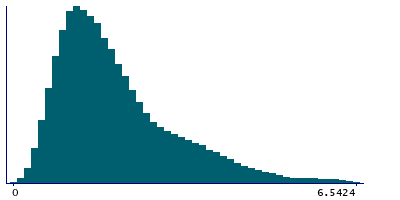
Instance 2 : On-line cycle 2, June 2011 to September 2011.
83,140 participants, 83,140 items
| Maximum | 23.7716 |
| Decile 9 | 3.6733 |
| Decile 8 | 2.85428 |
| Decile 7 | 2.31732 |
| Decile 6 | 1.96903 |
| Median | 1.69898 |
| Decile 4 | 1.46988 |
| Decile 3 | 1.25611 |
| Decile 2 | 1.0471 |
| Decile 1 | 0.804297 |
| Minimum | 0 |
|
|
- Mean = 2.01236
- Std.dev = 1.23681
- 603 items above graph maximum of 6.5423
|
Instance 3 : On-line cycle 3, October 2011 to December 2011.
103,616 participants, 103,616 items
| Maximum | 16.0276 |
| Decile 9 | 3.53829 |
| Decile 8 | 2.73784 |
| Decile 7 | 2.25118 |
| Decile 6 | 1.93399 |
| Median | 1.68524 |
| Decile 4 | 1.47029 |
| Decile 3 | 1.26917 |
| Decile 2 | 1.05983 |
| Decile 1 | 0.813045 |
| Minimum | 0 |
|

|
- Mean = 1.96549
- Std.dev = 1.15636
- 726 items above graph maximum of 6.26354
|
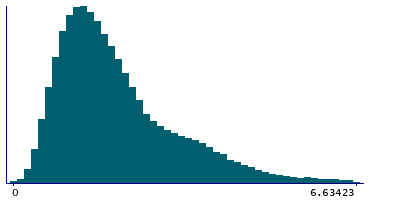
Instance 4 : On-line cycle 4, April 2012 to June 2012.
100,094 participants, 100,094 items
| Maximum | 18.3896 |
| Decile 9 | 3.72655 |
| Decile 8 | 2.91223 |
| Decile 7 | 2.35799 |
| Decile 6 | 2.00928 |
| Median | 1.73741 |
| Decile 4 | 1.50387 |
| Decile 3 | 1.28769 |
| Decile 2 | 1.07032 |
| Decile 1 | 0.819414 |
| Minimum | 0 |
|
|
- Mean = 2.04682
- Std.dev = 1.2404
- 634 items above graph maximum of 6.63369
|
