Data
457,927 items of data are available, covering 210,739 participants.
Defined-instances run from 0 to 4, labelled using Instancing
1.
Units of measurement are g.
| Maximum | 2618.38 |
| Decile 9 | 364.026 |
| Decile 8 | 318.447 |
| Decile 7 | 289.02 |
| Decile 6 | 265.685 |
| Median | 245.194 |
| Decile 4 | 225.583 |
| Decile 3 | 205.493 |
| Decile 2 | 182.75 |
| Decile 1 | 152.114 |
| Minimum | 0 |
|

|
- Mean = 253.673
- Std.dev = 88.5292
- 1813 items above graph maximum of 575.937
|
5 Instances
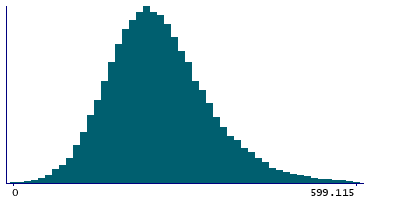
Instance 0 : Conducted in assessment centre, April 2009 to September 2010.
70,630 participants, 70,630 items
| Maximum | 2618.38 |
| Decile 9 | 374.493 |
| Decile 8 | 325.136 |
| Decile 7 | 293.806 |
| Decile 6 | 268.986 |
| Median | 247.366 |
| Decile 4 | 226.915 |
| Decile 3 | 205.504 |
| Decile 2 | 181.646 |
| Decile 1 | 149.869 |
| Minimum | 0 |
|
|
- Mean = 257.233
- Std.dev = 95.2757
- 357 items above graph maximum of 599.118
|
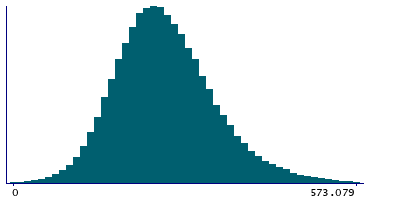
Instance 1 : On-line cycle 1, February 2011 to April 2011.
100,447 participants, 100,447 items
| Maximum | 1270.22 |
| Decile 9 | 363.973 |
| Decile 8 | 319.683 |
| Decile 7 | 290.79 |
| Decile 6 | 267.773 |
| Median | 247.231 |
| Decile 4 | 227.655 |
| Decile 3 | 207.66 |
| Decile 2 | 185.001 |
| Decile 1 | 154.79 |
| Minimum | 0 |
|
|
- Mean = 255.156
- Std.dev = 86.9061
- 372 items above graph maximum of 573.157
|
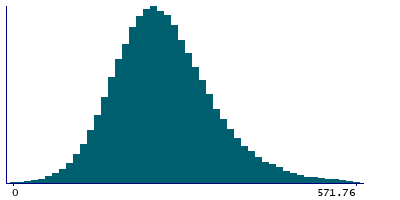
Instance 2 : On-line cycle 2, June 2011 to September 2011.
83,140 participants, 83,140 items
| Maximum | 1651.49 |
| Decile 9 | 362.432 |
| Decile 8 | 316.894 |
| Decile 7 | 287.342 |
| Decile 6 | 264.251 |
| Median | 243.86 |
| Decile 4 | 224.416 |
| Decile 3 | 204.597 |
| Decile 2 | 182.392 |
| Decile 1 | 151.72 |
| Minimum | 0 |
|

|
- Mean = 252.213
- Std.dev = 87.6613
- 306 items above graph maximum of 573.144
|
Instance 3 : On-line cycle 3, October 2011 to December 2011.
103,616 participants, 103,616 items
| Maximum | 1386.44 |
| Decile 9 | 360.614 |
| Decile 8 | 315.909 |
| Decile 7 | 286.636 |
| Decile 6 | 263.616 |
| Median | 243.614 |
| Decile 4 | 224.151 |
| Decile 3 | 204.223 |
| Decile 2 | 181.907 |
| Decile 1 | 151.468 |
| Minimum | 0 |
|

|
- Mean = 251.745
- Std.dev = 86.3994
- 352 items above graph maximum of 569.759
|
Instance 4 : On-line cycle 4, April 2012 to June 2012.
100,094 participants, 100,094 items
| Maximum | 1912.84 |
| Decile 9 | 361.885 |
| Decile 8 | 316.946 |
| Decile 7 | 287.89 |
| Decile 6 | 264.887 |
| Median | 244.629 |
| Decile 4 | 225.286 |
| Decile 3 | 205.414 |
| Decile 2 | 182.592 |
| Decile 1 | 152.059 |
| Minimum | 0 |
|
|
- Mean = 252.88
- Std.dev = 87.997
- 420 items above graph maximum of 571.711
|
