Data
457,927 items of data are available, covering 210,739 participants.
Defined-instances run from 0 to 4, labelled using Instancing
1.
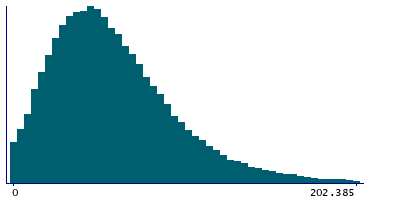
Units of measurement are g.
| Maximum | 944.101 |
| Decile 9 | 110.502 |
| Decile 8 | 87.3503 |
| Decile 7 | 73.1563 |
| Decile 6 | 62.3367 |
| Median | 53.0817 |
| Decile 4 | 44.74 |
| Decile 3 | 36.5161 |
| Decile 2 | 27.9385 |
| Decile 1 | 17.5973 |
| Minimum | 0 |
|
|
- Mean = 60.2973
- Std.dev = 40.0635
- 3439 items above graph maximum of 203.407
|
5 Instances
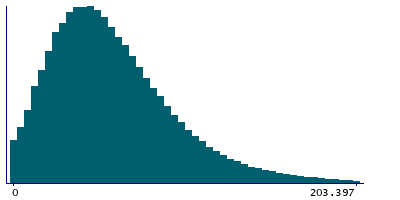
Instance 0 : Conducted in assessment centre, April 2009 to September 2010.
70,630 participants, 70,630 items
| Maximum | 913.628 |
| Decile 9 | 114.958 |
| Decile 8 | 89.8384 |
| Decile 7 | 74.662 |
| Decile 6 | 63.2033 |
| Median | 53.1936 |
| Decile 4 | 44.4186 |
| Decile 3 | 35.9058 |
| Decile 2 | 27.1596 |
| Decile 1 | 16.6454 |
| Minimum | 0 |
|
|
- Mean = 61.5108
- Std.dev = 43.063
- 543 items above graph maximum of 213.271
|
Instance 1 : On-line cycle 1, February 2011 to April 2011.
100,447 participants, 100,447 items
| Maximum | 476.225 |
| Decile 9 | 109.397 |
| Decile 8 | 86.9736 |
| Decile 7 | 72.8962 |
| Decile 6 | 62.0761 |
| Median | 52.9819 |
| Decile 4 | 44.7002 |
| Decile 3 | 36.6375 |
| Decile 2 | 28.0258 |
| Decile 1 | 17.6886 |
| Minimum | 0 |
|

|
- Mean = 59.972
- Std.dev = 39.2608
- 731 items above graph maximum of 201.106
|
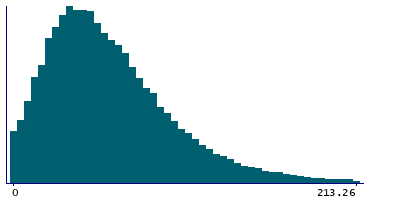
Instance 2 : On-line cycle 2, June 2011 to September 2011.
83,140 participants, 83,140 items
| Maximum | 767.217 |
| Decile 9 | 112.189 |
| Decile 8 | 88.7429 |
| Decile 7 | 74.6087 |
| Decile 6 | 63.7797 |
| Median | 54.5039 |
| Decile 4 | 46.0786 |
| Decile 3 | 37.6425 |
| Decile 2 | 28.8917 |
| Decile 1 | 18.5331 |
| Minimum | 0 |
|
|
- Mean = 61.5595
- Std.dev = 40.1712
- 604 items above graph maximum of 205.845
|
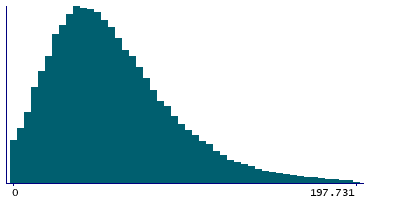
Instance 3 : On-line cycle 3, October 2011 to December 2011.
103,616 participants, 103,616 items
| Maximum | 586.324 |
| Decile 9 | 107.406 |
| Decile 8 | 84.9212 |
| Decile 7 | 71.1285 |
| Decile 6 | 60.5451 |
| Median | 51.6069 |
| Decile 4 | 43.5009 |
| Decile 3 | 35.6375 |
| Decile 2 | 27.2273 |
| Decile 1 | 17.0807 |
| Minimum | 0 |
|
|
- Mean = 58.6182
- Std.dev = 38.7592
- 784 items above graph maximum of 197.73
|
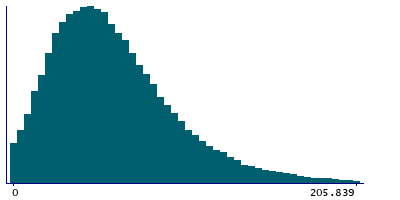
Instance 4 : On-line cycle 4, April 2012 to June 2012.
100,094 participants, 100,094 items
| Maximum | 944.101 |
| Decile 9 | 110.124 |
| Decile 8 | 87.2468 |
| Decile 7 | 73.4027 |
| Decile 6 | 62.6371 |
| Median | 53.4166 |
| Decile 4 | 45.1927 |
| Decile 3 | 36.8968 |
| Decile 2 | 28.2986 |
| Decile 1 | 17.8834 |
| Minimum | 0 |
|
|
- Mean = 60.4574
- Std.dev = 39.8354
- 764 items above graph maximum of 202.364
|
