Data
457,927 items of data are available, covering 210,739 participants.
Defined-instances run from 0 to 4, labelled using Instancing
1.
Units of measurement are g.
| Maximum | 297.45 |
| Decile 9 | 42.6283 |
| Decile 8 | 36.1319 |
| Decile 7 | 32.252 |
| Decile 6 | 29.2337 |
| Median | 26.6625 |
| Decile 4 | 24.2807 |
| Decile 3 | 21.8526 |
| Decile 2 | 19.115 |
| Decile 1 | 15.4614 |
| Minimum | 0 |
|
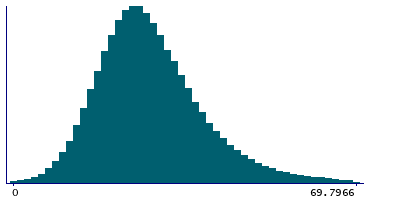
|
- Mean = 28.2634
- Std.dev = 11.7681
- 3307 items above graph maximum of 69.7952
|
5 Instances
Instance 0 : Conducted in assessment centre, April 2009 to September 2010.
70,630 participants, 70,630 items
| Maximum | 297.45 |
| Decile 9 | 43.8379 |
| Decile 8 | 36.8789 |
| Decile 7 | 32.7923 |
| Decile 6 | 29.563 |
| Median | 26.7896 |
| Decile 4 | 24.2934 |
| Decile 3 | 21.7742 |
| Decile 2 | 18.8839 |
| Decile 1 | 15.0441 |
| Minimum | 0 |
|
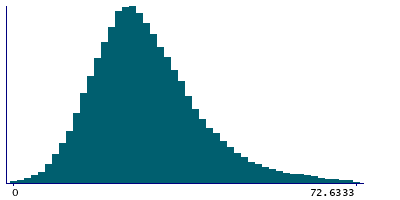
|
- Mean = 28.6067
- Std.dev = 12.5715
- 537 items above graph maximum of 72.6318
|
Instance 1 : On-line cycle 1, February 2011 to April 2011.
100,447 participants, 100,447 items
| Maximum | 171.126 |
| Decile 9 | 42.6516 |
| Decile 8 | 36.2393 |
| Decile 7 | 32.4022 |
| Decile 6 | 29.4112 |
| Median | 26.8683 |
| Decile 4 | 24.4814 |
| Decile 3 | 22.0371 |
| Decile 2 | 19.3762 |
| Decile 1 | 15.7753 |
| Minimum | 0 |
|
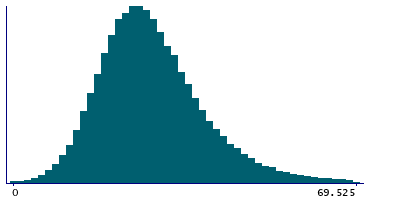
|
- Mean = 28.4166
- Std.dev = 11.5753
- 671 items above graph maximum of 69.5279
|
Instance 2 : On-line cycle 2, June 2011 to September 2011.
83,140 participants, 83,140 items
| Maximum | 190.234 |
| Decile 9 | 42.0745 |
| Decile 8 | 35.7578 |
| Decile 7 | 31.9784 |
| Decile 6 | 29.0125 |
| Median | 26.433 |
| Decile 4 | 24.0509 |
| Decile 3 | 21.6275 |
| Decile 2 | 18.8763 |
| Decile 1 | 15.2876 |
| Minimum | 0 |
|
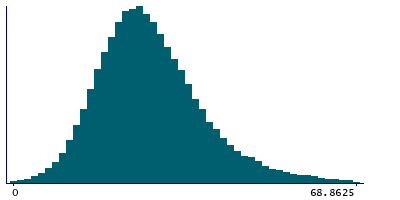
|
- Mean = 27.9591
- Std.dev = 11.6161
- 604 items above graph maximum of 68.8613
|
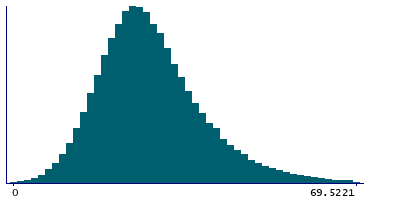
Instance 3 : On-line cycle 3, October 2011 to December 2011.
103,616 participants, 103,616 items
| Maximum | 191.624 |
| Decile 9 | 42.5606 |
| Decile 8 | 36.1329 |
| Decile 7 | 32.1917 |
| Decile 6 | 29.249 |
| Median | 26.6999 |
| Decile 4 | 24.3262 |
| Decile 3 | 21.9657 |
| Decile 2 | 19.2566 |
| Decile 1 | 15.6004 |
| Minimum | 0 |
|
|
- Mean = 28.2913
- Std.dev = 11.5983
- 717 items above graph maximum of 69.5207
|
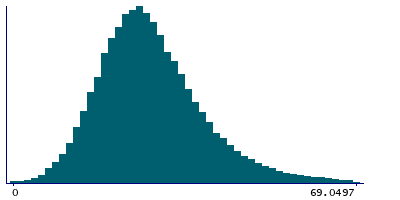
Instance 4 : On-line cycle 4, April 2012 to June 2012.
100,094 participants, 100,094 items
| Maximum | 277.967 |
| Decile 9 | 42.2376 |
| Decile 8 | 35.8399 |
| Decile 7 | 32.0187 |
| Decile 6 | 29.0267 |
| Median | 26.5192 |
| Decile 4 | 24.1928 |
| Decile 3 | 21.7805 |
| Decile 2 | 19.0473 |
| Decile 1 | 15.4274 |
| Minimum | 0 |
|
|
- Mean = 28.0913
- Std.dev = 11.664
- 750 items above graph maximum of 69.0478
|


