Data
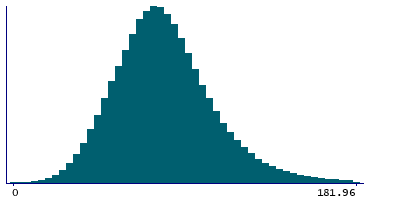
457,927 items of data are available, covering 210,739 participants.
Defined-instances run from 0 to 4, labelled using Instancing
1.
Units of measurement are g.
| Maximum | 795.952 |
| Decile 9 | 115.199 |
| Decile 8 | 100.463 |
| Decile 7 | 91.3478 |
| Decile 6 | 84.2625 |
| Median | 78.0108 |
| Decile 4 | 72.0066 |
| Decile 3 | 65.7158 |
| Decile 2 | 58.3552 |
| Decile 1 | 48.4316 |
| Minimum | 0 |
|
|
- Mean = 80.7342
- Std.dev = 28.3542
- 2548 items above graph maximum of 181.966
|
5 Instances
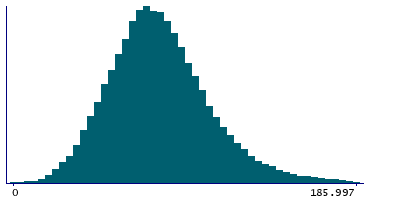
Instance 0 : Conducted in assessment centre, April 2009 to September 2010.
70,630 participants, 70,630 items
| Maximum | 795.952 |
| Decile 9 | 116.174 |
| Decile 8 | 100.805 |
| Decile 7 | 91.2752 |
| Decile 6 | 83.815 |
| Median | 77.2387 |
| Decile 4 | 70.8977 |
| Decile 3 | 64.4423 |
| Decile 2 | 56.7311 |
| Decile 1 | 46.3472 |
| Minimum | 0 |
|
|
- Mean = 80.1796
- Std.dev = 29.9136
- 432 items above graph maximum of 186
|
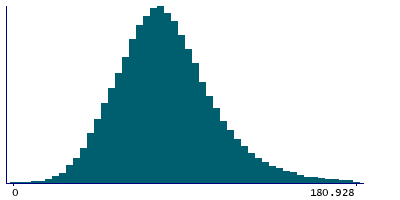
Instance 1 : On-line cycle 1, February 2011 to April 2011.
100,447 participants, 100,447 items
| Maximum | 611.899 |
| Decile 9 | 115.091 |
| Decile 8 | 100.651 |
| Decile 7 | 91.8006 |
| Decile 6 | 84.8 |
| Median | 78.6348 |
| Decile 4 | 72.7602 |
| Decile 3 | 66.4024 |
| Decile 2 | 59.145 |
| Decile 1 | 49.2469 |
| Minimum | 0 |
|
|
- Mean = 81.2197
- Std.dev = 27.903
- 522 items above graph maximum of 180.936
|
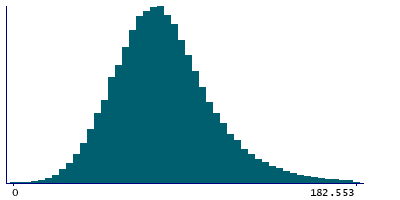
Instance 2 : On-line cycle 2, June 2011 to September 2011.
83,140 participants, 83,140 items
| Maximum | 763.429 |
| Decile 9 | 115.51 |
| Decile 8 | 100.402 |
| Decile 7 | 91.2546 |
| Decile 6 | 84.1761 |
| Median | 77.9208 |
| Decile 4 | 71.8518 |
| Decile 3 | 65.5888 |
| Decile 2 | 58.3319 |
| Decile 1 | 48.4667 |
| Minimum | 0 |
|
|
- Mean = 80.7821
- Std.dev = 28.6342
- 498 items above graph maximum of 182.554
|
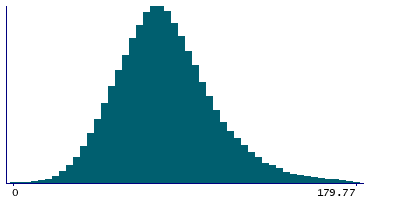
Instance 3 : On-line cycle 3, October 2011 to December 2011.
103,616 participants, 103,616 items
| Maximum | 563.182 |
| Decile 9 | 114.237 |
| Decile 8 | 99.7882 |
| Decile 7 | 90.9387 |
| Decile 6 | 83.923 |
| Median | 77.8296 |
| Decile 4 | 71.9499 |
| Decile 3 | 65.7804 |
| Decile 2 | 58.492 |
| Decile 1 | 48.694 |
| Minimum | 0 |
|
|
- Mean = 80.3838
- Std.dev = 27.5223
- 538 items above graph maximum of 179.779
|
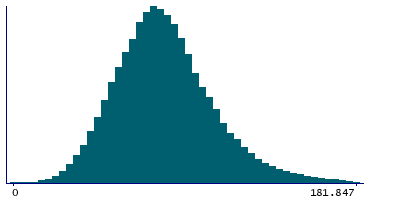
Instance 4 : On-line cycle 4, April 2012 to June 2012.
100,094 participants, 100,094 items
| Maximum | 658.464 |
| Decile 9 | 115.326 |
| Decile 8 | 100.758 |
| Decile 7 | 91.4043 |
| Decile 6 | 84.4167 |
| Median | 78.1661 |
| Decile 4 | 72.2365 |
| Decile 3 | 65.987 |
| Decile 2 | 58.5712 |
| Decile 1 | 48.8147 |
| Minimum | 0 |
|
|
- Mean = 80.9614
- Std.dev = 28.2762
- 563 items above graph maximum of 181.836
|


