Data
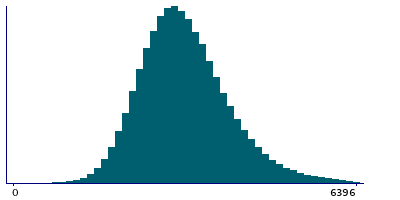
457,927 items of data are available, covering 210,739 participants.
Defined-instances run from 0 to 4, labelled using Instancing
1.
Units of measurement are g.
| Maximum | 19086.5 |
| Decile 9 | 4308 |
| Decile 8 | 3848 |
| Decile 7 | 3556.5 |
| Decile 6 | 3326 |
| Median | 3121.5 |
| Decile 4 | 2929 |
| Decile 3 | 2732.5 |
| Decile 2 | 2510.5 |
| Decile 1 | 2220 |
| Minimum | 0 |
|
|
- Mean = 3213.15
- Std.dev = 866.255
- 1782 items above graph maximum of 6396
|
5 Instances
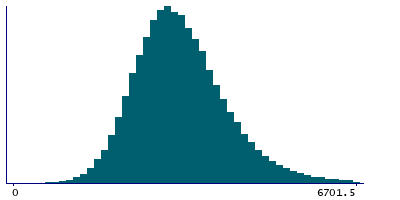
Instance 0 : Conducted in assessment centre, April 2009 to September 2010.
70,630 participants, 70,630 items
| Maximum | 19086.5 |
| Decile 9 | 4459.55 |
| Decile 8 | 3968 |
| Decile 7 | 3657 |
| Decile 6 | 3408 |
| Median | 3188 |
| Decile 4 | 2979 |
| Decile 3 | 2770 |
| Decile 2 | 2531.25 |
| Decile 1 | 2218 |
| Minimum | 0 |
|
|
- Mean = 3286.37
- Std.dev = 942.262
- 301 items above graph maximum of 6701.1
|
Instance 1 : On-line cycle 1, February 2011 to April 2011.
100,447 participants, 100,447 items
| Maximum | 13841.5 |
| Decile 9 | 4288.5 |
| Decile 8 | 3839 |
| Decile 7 | 3553.31 |
| Decile 6 | 3324.5 |
| Median | 3123 |
| Decile 4 | 2932.75 |
| Decile 3 | 2737.5 |
| Decile 2 | 2517 |
| Decile 1 | 2230.5 |
| Minimum | 0 |
|

|
- Mean = 3210.46
- Std.dev = 847.236
- 371 items above graph maximum of 6346.5
|
Instance 2 : On-line cycle 2, June 2011 to September 2011.
83,140 participants, 83,140 items
| Maximum | 17023 |
| Decile 9 | 4353 |
| Decile 8 | 3889.5 |
| Decile 7 | 3595.25 |
| Decile 6 | 3362.75 |
| Median | 3155 |
| Decile 4 | 2962.25 |
| Decile 3 | 2762.5 |
| Decile 2 | 2540 |
| Decile 1 | 2250.25 |
| Minimum | 0 |
|

|
- Mean = 3248.95
- Std.dev = 870.923
- 315 items above graph maximum of 6455.75
|
Instance 3 : On-line cycle 3, October 2011 to December 2011.
103,616 participants, 103,616 items
| Maximum | 13414 |
| Decile 9 | 4207.77 |
| Decile 8 | 3760.25 |
| Decile 7 | 3482 |
| Decile 6 | 3257.25 |
| Median | 3060.5 |
| Decile 4 | 2875 |
| Decile 3 | 2685 |
| Decile 2 | 2470.25 |
| Decile 1 | 2186 |
| Minimum | 0 |
|

|
- Mean = 3147.32
- Std.dev = 833.608
- 405 items above graph maximum of 6229.55
|
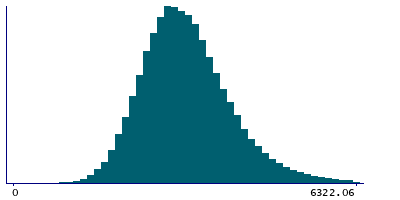
Instance 4 : On-line cycle 4, April 2012 to June 2012.
100,094 participants, 100,094 items
| Maximum | 16681.8 |
| Decile 9 | 4273.5 |
| Decile 8 | 3827.62 |
| Decile 7 | 3540 |
| Decile 6 | 3314.5 |
| Median | 3114.25 |
| Decile 4 | 2920.5 |
| Decile 3 | 2729 |
| Decile 2 | 2512 |
| Decile 1 | 2224.94 |
| Minimum | 0 |
|
|
- Mean = 3202.61
- Std.dev = 852.855
- 382 items above graph maximum of 6322.06
|
