Data
79,298 items of data are available, covering 74,967 participants.
Defined-instances run from 2 to 3, labelled using Instancing
2.
Units of measurement are units.
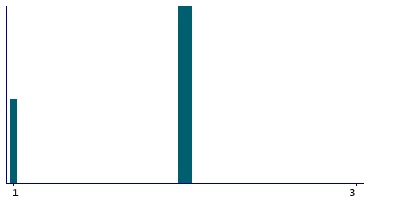
| Maximum | 6 |
| Decile 9 | 2 |
| Decile 8 | 2 |
| Decile 7 | 2 |
| Decile 6 | 2 |
| Median | 2 |
| Decile 4 | 2 |
| Decile 3 | 2 |
| Decile 2 | 2 |
| Decile 1 | 1 |
| Minimum | 1 |
|
|
- Mean = 1.84921
- Std.dev = 0.358544
- 2 items above graph maximum of 3
|
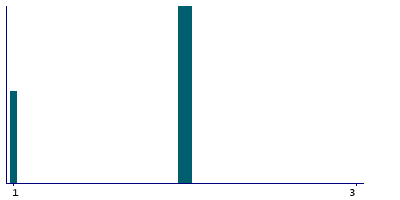
2 Instances
Instance 2 : Imaging visit (2014+)
74,644 participants, 74,644 items
| Maximum | 6 |
| Decile 9 | 2 |
| Decile 8 | 2 |
| Decile 7 | 2 |
| Decile 6 | 2 |
| Median | 2 |
| Decile 4 | 2 |
| Decile 3 | 2 |
| Decile 2 | 2 |
| Decile 1 | 1 |
| Minimum | 1 |
|
|
- Mean = 1.83981
- Std.dev = 0.367509
- 2 items above graph maximum of 3
|
Instance 3 : First repeat imaging visit (2019+)
4,654 participants, 4,654 items
Too few values for statistical summary.
Notes
Intensity scaling for SWI
0 Related Data-Fields
There are no related data-fields
0 Resources
There are no matching Resources
