Data
73,784 items of data are available, covering 69,834 participants.
Defined-instances run from 2 to 3, labelled using Instancing
2.
Units of measurement are milliseconds.
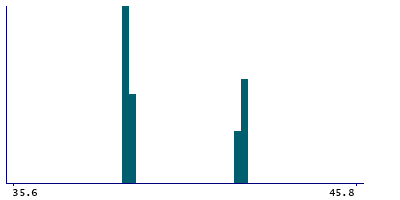
| Maximum | 92 |
| Decile 9 | 42.4 |
| Decile 8 | 42.4 |
| Decile 7 | 39 |
| Decile 6 | 39 |
| Median | 39 |
| Decile 4 | 39 |
| Decile 3 | 39 |
| Decile 2 | 39 |
| Decile 1 | 39 |
| Minimum | 34.8 |
|
|
- Mean = 39.9974
- Std.dev = 1.55984
- 2 items below graph minimum of 35.6
- 1 item above graph maximum of 45.8
|
2 Instances
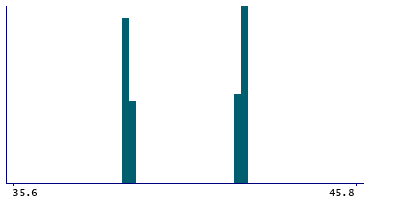
Instance 2 : Imaging visit (2014+)
69,471 participants, 69,471 items
| Maximum | 92 |
| Decile 9 | 42.4 |
| Decile 8 | 42.4 |
| Decile 7 | 42.4 |
| Decile 6 | 39 |
| Median | 39 |
| Decile 4 | 39 |
| Decile 3 | 39 |
| Decile 2 | 39 |
| Decile 1 | 39 |
| Minimum | 34.8 |
|
|
- Mean = 40.0256
- Std.dev = 1.57298
- 2 items below graph minimum of 35.6
- 1 item above graph maximum of 45.8
|
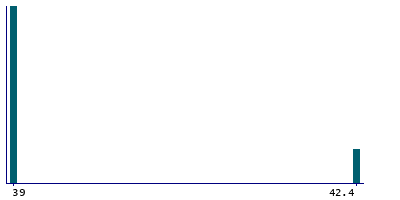
Instance 3 : First repeat imaging visit (2019+)
4,313 participants, 4,313 items
| Maximum | 42.4 |
| Decile 9 | 42.4 |
| Decile 8 | 39 |
| Decile 7 | 39 |
| Decile 6 | 39 |
| Median | 39 |
| Decile 4 | 39 |
| Decile 3 | 39 |
| Decile 2 | 39 |
| Decile 1 | 39 |
| Minimum | 39 |
|
|
- Mean = 39.5424
- Std.dev = 1.24494
|
Notes
Echo Time for the tfMRI
0 Related Data-Fields
There are no related data-fields
0 Resources
There are no matching Resources
