Data
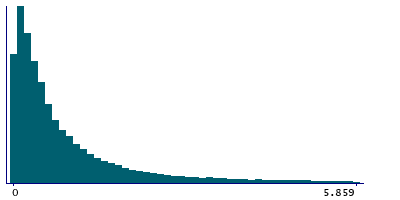
460,642 items of data are available, covering 440,493 participants.
Defined-instances run from 0 to 1, labelled using Instancing
2.
Units of measurement are percent.
| Maximum | 59.44 |
| Decile 9 | 2.9605 |
| Decile 8 | 1.607 |
| Decile 7 | 1.058 |
| Decile 6 | 0.738 |
| Median | 0.523 |
| Decile 4 | 0.373 |
| Decile 3 | 0.25 |
| Decile 2 | 0.151 |
| Decile 1 | 0.061 |
| Minimum | 0 |
|

|
- Mean = 1.25739
- Std.dev = 2.4541
- 16924 items above graph maximum of 5.86
|
2 Instances
Instance 0 : Initial assessment visit (2006-2010) at which participants were recruited and consent given
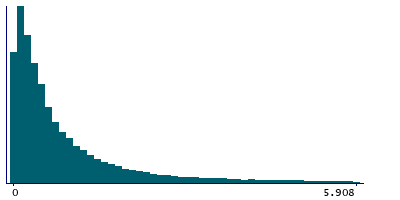
440,340 participants, 440,340 items
| Maximum | 59.44 |
| Decile 9 | 2.983 |
| Decile 8 | 1.599 |
| Decile 7 | 1.047 |
| Decile 6 | 0.726 |
| Median | 0.513 |
| Decile 4 | 0.366 |
| Decile 3 | 0.245 |
| Decile 2 | 0.147 |
| Decile 1 | 0.058 |
| Minimum | 0 |
|

|
- Mean = 1.25856
- Std.dev = 2.47074
- 16334 items above graph maximum of 5.908
|
Instance 1 : First repeat assessment visit (2012-13)
20,302 participants, 20,302 items
| Maximum | 52.955 |
| Decile 9 | 2.636 |
| Decile 8 | 1.712 |
| Decile 7 | 1.239 |
| Decile 6 | 0.95 |
| Median | 0.723 |
| Decile 4 | 0.543 |
| Decile 3 | 0.395 |
| Decile 2 | 0.259 |
| Decile 1 | 0.145 |
| Minimum | 0 |
|

|
- Mean = 1.23181
- Std.dev = 2.06027
- 558 items above graph maximum of 5.127
|
Notes
The percentage of the home location buffer classed as 'Water', as a proportion of all land-use types, and with home location data buffered at 1000m.
Land use data were obtained from the Generalized land use database for England (GLUD) 2005 data at the 2001 Census Output Area level. Each home location polygon was then allocated an area weighted mean of the land use percentage coverage for the 2001 Census Output Areas intersecting the home location buffer. Data are only available for participants whose home location was in England.
Further details of the methods used to derive these data can be found in Resource 15374, where this field is derived from variables referred to as wa1000_0 and wa1000_1.
0 Related Data-Fields
There are no related data-fields


