Data
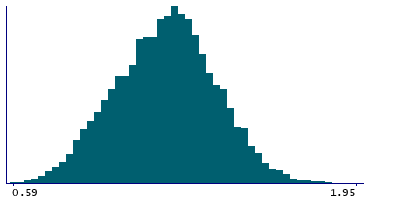
8,865 items of data are available, covering 8,865 participants.
Defined-instances run from 2 to 3, labelled using Instancing
2.
| Maximum | 2.63 |
| Decile 9 | 1.44 |
| Decile 8 | 1.36 |
| Decile 7 | 1.3 |
| Decile 6 | 1.25 |
| Median | 1.2 |
| Decile 4 | 1.15 |
| Decile 3 | 1.09 |
| Decile 2 | 1.02 |
| Decile 1 | 0.93 |
| Minimum | 0.59 |
|
|
- Mean = 1.1954
- Std.dev = 0.198116
- 6 items above graph maximum of 1.95
|
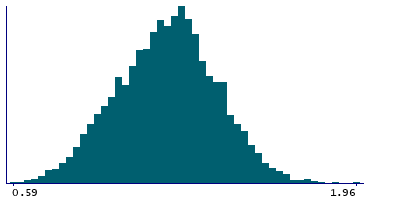
2 Instances
Instance 2 : Imaging visit (2014+)
7,066 participants, 7,066 items
| Maximum | 2.63 |
| Decile 9 | 1.45 |
| Decile 8 | 1.37 |
| Decile 7 | 1.31 |
| Decile 6 | 1.26 |
| Median | 1.21 |
| Decile 4 | 1.16 |
| Decile 3 | 1.1 |
| Decile 2 | 1.03 |
| Decile 1 | 0.94 |
| Minimum | 0.59 |
|
|
- Mean = 1.20285
- Std.dev = 0.198799
- 5 items above graph maximum of 1.96
|
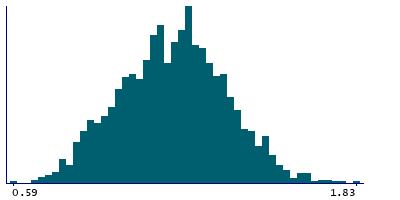
Instance 3 : First repeat imaging visit (2019+)
1,799 participants, 1,799 items
| Maximum | 1.83 |
| Decile 9 | 1.41 |
| Decile 8 | 1.33 |
| Decile 7 | 1.27 |
| Decile 6 | 1.22 |
| Median | 1.17 |
| Decile 4 | 1.12 |
| Decile 3 | 1.07 |
| Decile 2 | 0.99 |
| Decile 1 | 0.91 |
| Minimum | 0.59 |
|
|
- Mean = 1.16616
- Std.dev = 0.192644
|
Notes
Precision-weighted mean ATT (arterial transit time) in the left Thalamus
0 Related Data-Fields
There are no related data-fields


