Data
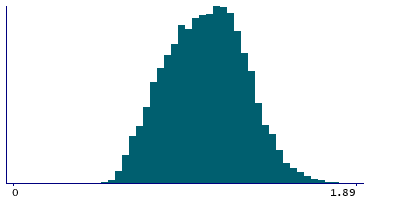
8,865 items of data are available, covering 8,865 participants.
Defined-instances run from 2 to 3, labelled using Instancing
2.
| Maximum | 2.25 |
| Decile 9 | 1.34 |
| Decile 8 | 1.26 |
| Decile 7 | 1.19 |
| Decile 6 | 1.13 |
| Median | 1.07 |
| Decile 4 | 1.01 |
| Decile 3 | 0.94 |
| Decile 2 | 0.87 |
| Decile 1 | 0.78 |
| Minimum | 0.51 |
|
|
- Mean = 1.06824
- Std.dev = 0.216695
- 3 items above graph maximum of 1.9
|
2 Instances
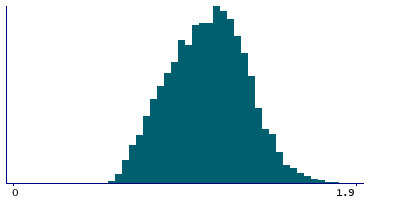
Instance 2 : Imaging visit (2014+)
7,066 participants, 7,066 items
| Maximum | 2.25 |
| Decile 9 | 1.35 |
| Decile 8 | 1.27 |
| Decile 7 | 1.2 |
| Decile 6 | 1.15 |
| Median | 1.09 |
| Decile 4 | 1.03 |
| Decile 3 | 0.96 |
| Decile 2 | 0.89 |
| Decile 1 | 0.79 |
| Minimum | 0.52 |
|
|
- Mean = 1.08219
- Std.dev = 0.214265
- 2 items above graph maximum of 1.91
|
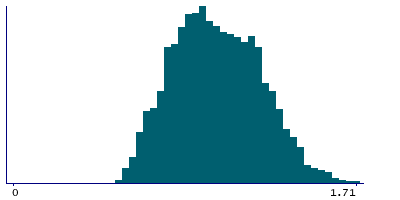
Instance 3 : First repeat imaging visit (2019+)
1,799 participants, 1,799 items
| Maximum | 1.71 |
| Decile 9 | 1.3 |
| Decile 8 | 1.21 |
| Decile 7 | 1.14 |
| Decile 6 | 1.07 |
| Median | 1 |
| Decile 4 | 0.94 |
| Decile 3 | 0.88 |
| Decile 2 | 0.82 |
| Decile 1 | 0.74 |
| Minimum | 0.51 |
|
|
- Mean = 1.01342
- Std.dev = 0.217486
|
Notes
Precision-weighted mean ATT (arterial transit time) in the left Caudate
0 Related Data-Fields
There are no related data-fields


