Data
8,865 items of data are available, covering 8,865 participants.
Defined-instances run from 2 to 3, labelled using Instancing
2.
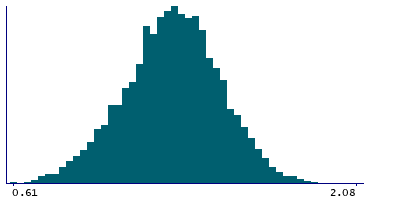
| Maximum | 2.21 |
| Decile 9 | 1.55 |
| Decile 8 | 1.46 |
| Decile 7 | 1.4 |
| Decile 6 | 1.35 |
| Median | 1.3 |
| Decile 4 | 1.25 |
| Decile 3 | 1.19 |
| Decile 2 | 1.12 |
| Decile 1 | 1.02 |
| Minimum | 0.61 |
|
|
- Mean = 1.29166
- Std.dev = 0.202057
- 2 items above graph maximum of 2.08
|
2 Instances
Instance 2 : Imaging visit (2014+)
7,066 participants, 7,066 items
| Maximum | 2.21 |
| Decile 9 | 1.55 |
| Decile 8 | 1.47 |
| Decile 7 | 1.4 |
| Decile 6 | 1.35 |
| Median | 1.3 |
| Decile 4 | 1.25 |
| Decile 3 | 1.2 |
| Decile 2 | 1.13 |
| Decile 1 | 1.03 |
| Minimum | 0.61 |
|

|
- Mean = 1.29633
- Std.dev = 0.201084
- 2 items above graph maximum of 2.07
|
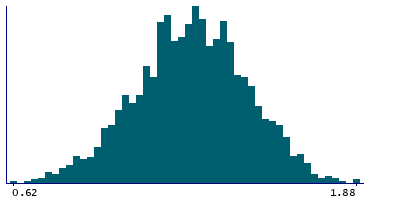
Instance 3 : First repeat imaging visit (2019+)
1,799 participants, 1,799 items
| Maximum | 1.88 |
| Decile 9 | 1.54 |
| Decile 8 | 1.45 |
| Decile 7 | 1.39 |
| Decile 6 | 1.33 |
| Median | 1.28 |
| Decile 4 | 1.22 |
| Decile 3 | 1.17 |
| Decile 2 | 1.1 |
| Decile 1 | 1.01 |
| Minimum | 0.62 |
|
|
- Mean = 1.2733
- Std.dev = 0.204808
|
Notes
Precision-weighted mean ATT (arterial transit time) in the right Parietal Lobe in voxels with >70% grey matter partial volume
0 Related Data-Fields
There are no related data-fields


