Data
75,160 items of data are available, covering 71,239 participants.
Defined-instances run from 2 to 3, labelled using Instancing
2.
Units of measurement are 10^-3/mmHg.
| Maximum | 285.714 |
| Decile 9 | 3.61847 |
| Decile 8 | 2.91219 |
| Decile 7 | 2.4871 |
| Decile 6 | 2.16957 |
| Median | 1.90549 |
| Decile 4 | 1.67387 |
| Decile 3 | 1.45202 |
| Decile 2 | 1.22768 |
| Decile 1 | 0.969103 |
| Minimum | -131.944 |
|
|
- Mean = 2.46735
- Std.dev = 5.47348
- 56 items below graph minimum of -1.68026
- 1336 items above graph maximum of 6.26783
|
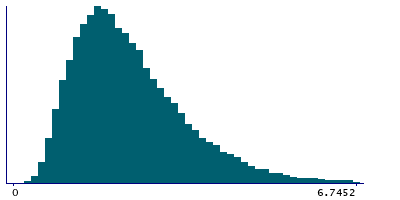
2 Instances
Instance 2 : Imaging visit (2014+)
70,518 participants, 70,518 items
| Maximum | 285.714 |
| Decile 9 | 3.61176 |
| Decile 8 | 2.90135 |
| Decile 7 | 2.47448 |
| Decile 6 | 2.15801 |
| Median | 1.89394 |
| Decile 4 | 1.66223 |
| Decile 3 | 1.44196 |
| Decile 2 | 1.21937 |
| Decile 1 | 0.963186 |
| Minimum | -131.944 |
|

|
- Mean = 2.46827
- Std.dev = 5.55155
- 56 items below graph minimum of -1.68539
- 1285 items above graph maximum of 6.26034
|
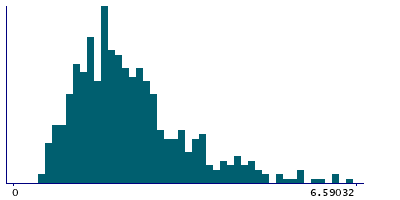
Instance 3 : First repeat imaging visit (2019+)
4,642 participants, 4,642 items
| Maximum | 173.913 |
| Decile 9 | 3.71111 |
| Decile 8 | 3.06952 |
| Decile 7 | 2.62788 |
| Decile 6 | 2.3539 |
| Median | 2.07207 |
| Decile 4 | 1.84025 |
| Decile 3 | 1.62492 |
| Decile 2 | 1.3769 |
| Decile 1 | 1.08116 |
| Minimum | 0.313725 |
|
|
- Mean = 2.45328
- Std.dev = 4.10887
- 50 items above graph maximum of 6.34106
|
Notes
Descending aorta distensibility
0 Related Data-Fields
There are no related data-fields
0 Resources
There are no matching Resources
