Data
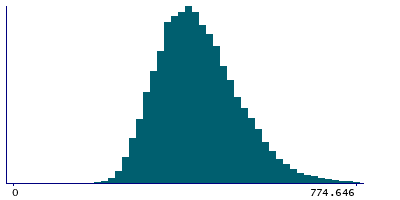
79,757 items of data are available, covering 75,232 participants.
Defined-instances run from 2 to 3, labelled using Instancing
2.
Units of measurement are mm2.
| Maximum | 1306.12 |
| Decile 9 | 551.528 |
| Decile 8 | 503.896 |
| Decile 7 | 468.799 |
| Decile 6 | 441.222 |
| Median | 418.66 |
| Decile 4 | 396.097 |
| Decile 3 | 371.028 |
| Decile 2 | 345.958 |
| Decile 1 | 315.875 |
| Minimum | 25.0694 |
|

|
- Mean = 427.863
- Std.dev = 95.1289
- 161 items above graph maximum of 787.181
|
2 Instances
Instance 2 : Imaging visit (2014+)
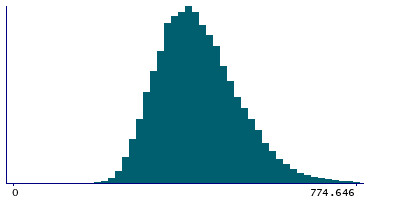
75,014 participants, 75,014 items
| Maximum | 1306.12 |
| Decile 9 | 554.035 |
| Decile 8 | 503.896 |
| Decile 7 | 468.799 |
| Decile 6 | 443.729 |
| Median | 418.66 |
| Decile 4 | 396.097 |
| Decile 3 | 371.028 |
| Decile 2 | 345.958 |
| Decile 1 | 315.875 |
| Minimum | 25.0694 |
|

|
- Mean = 428.158
- Std.dev = 95.2005
- 145 items above graph maximum of 792.195
|
Instance 3 : First repeat imaging visit (2019+)
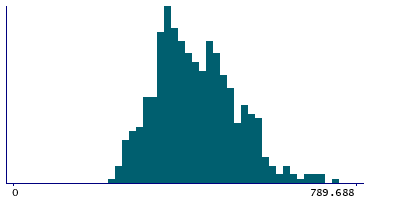
4,743 participants, 4,743 items
| Maximum | 1103.06 |
| Decile 9 | 544.007 |
| Decile 8 | 498.882 |
| Decile 7 | 463.785 |
| Decile 6 | 436.208 |
| Median | 413.646 |
| Decile 4 | 391.083 |
| Decile 3 | 368.521 |
| Decile 2 | 343.451 |
| Decile 1 | 310.861 |
| Minimum | 200.556 |
|

|
- Mean = 423.204
- Std.dev = 93.8658
- 10 items above graph maximum of 777.153
|
Notes
Descending aorta minimum area
0 Related Data-Fields
There are no related data-fields
0 Resources
There are no matching Resources


