Data
79,757 items of data are available, covering 75,232 participants.
Defined-instances run from 2 to 3, labelled using Instancing
2.
Units of measurement are mm2.
| Maximum | 2825.33 |
| Decile 9 | 1037.88 |
| Decile 8 | 935.09 |
| Decile 7 | 869.91 |
| Decile 6 | 817.264 |
| Median | 769.632 |
| Decile 4 | 727.014 |
| Decile 3 | 681.889 |
| Decile 2 | 634.257 |
| Decile 1 | 571.583 |
| Minimum | 22.5625 |
|

|
- Mean = 792.403
- Std.dev = 188.691
- 213 items above graph maximum of 1504.17
|
2 Instances
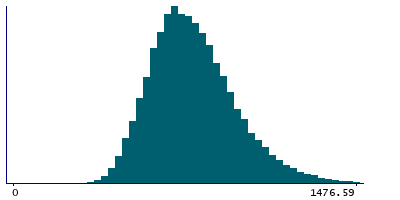
Instance 2 : Imaging visit (2014+)
75,014 participants, 75,014 items
| Maximum | 2825.33 |
| Decile 9 | 1040.38 |
| Decile 8 | 935.09 |
| Decile 7 | 869.91 |
| Decile 6 | 819.771 |
| Median | 772.139 |
| Decile 4 | 727.014 |
| Decile 3 | 684.396 |
| Decile 2 | 634.257 |
| Decile 1 | 574.09 |
| Minimum | 22.5625 |
|
|
- Mean = 793.151
- Std.dev = 188.867
- 202 items above graph maximum of 1506.67
|
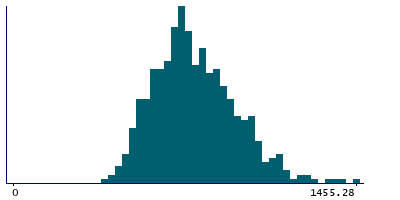
Instance 3 : First repeat imaging visit (2019+)
4,743 participants, 4,743 items
| Maximum | 2038.15 |
| Decile 9 | 1020.33 |
| Decile 8 | 925.063 |
| Decile 7 | 857.375 |
| Decile 6 | 804.729 |
| Median | 757.097 |
| Decile 4 | 714.479 |
| Decile 3 | 674.368 |
| Decile 2 | 621.722 |
| Decile 1 | 564.063 |
| Minimum | 213.09 |
|
|
- Mean = 780.572
- Std.dev = 185.494
- 11 items above graph maximum of 1476.59
|
Notes
Ascending aorta minimum area
0 Related Data-Fields
There are no related data-fields
0 Resources
There are no matching Resources
