Data
81,368 items of data are available, covering 76,738 participants.
Defined-instances run from 2 to 3, labelled using Instancing
2.
Units of measurement are %.
| Maximum | 99.1537 |
| Decile 9 | 71.3089 |
| Decile 8 | 67.2904 |
| Decile 7 | 64.639 |
| Decile 6 | 62.4825 |
| Median | 60.5268 |
| Decile 4 | 58.6024 |
| Decile 3 | 56.4972 |
| Decile 2 | 53.862 |
| Decile 1 | 49.7176 |
| Minimum | 9.35019 |
|

|
- Mean = 60.2501
- Std.dev = 9.96458
- 1208 items below graph minimum of 28.1263
- 185 items above graph maximum of 92.9002
|
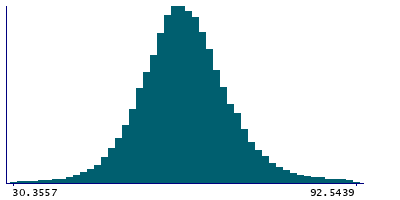
2 Instances
Instance 2 : Imaging visit (2014+)
76,626 participants, 76,626 items
| Maximum | 99.1537 |
| Decile 9 | 71.3666 |
| Decile 8 | 67.3284 |
| Decile 7 | 64.6613 |
| Decile 6 | 62.5089 |
| Median | 60.5434 |
| Decile 4 | 58.6101 |
| Decile 3 | 56.4907 |
| Decile 2 | 53.8382 |
| Decile 1 | 49.6484 |
| Minimum | 9.35019 |
|
|
- Mean = 60.2498
- Std.dev = 10.0322
- 1158 items below graph minimum of 27.9303
- 179 items above graph maximum of 93.0848
|
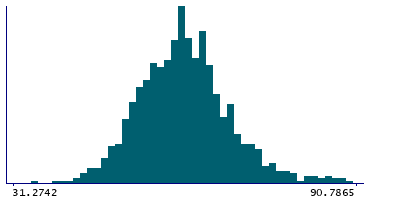
Instance 3 : First repeat imaging visit (2019+)
4,742 participants, 4,742 items
| Maximum | 96.1793 |
| Decile 9 | 70.5702 |
| Decile 8 | 66.6529 |
| Decile 7 | 64.1774 |
| Decile 6 | 62.0935 |
| Median | 60.212 |
| Decile 4 | 58.4906 |
| Decile 3 | 56.5562 |
| Decile 2 | 54.2161 |
| Decile 1 | 50.5668 |
| Minimum | 12.5895 |
|
|
- Mean = 60.2547
- Std.dev = 8.80018
- 51 items below graph minimum of 30.5635
- 4 items above graph maximum of 90.5736
|
Notes
Left atrium ejection fraction
0 Related Data-Fields
There are no related data-fields
0 Resources
There are no matching Resources
