Data
85,879 items of data are available, covering 80,974 participants.
Defined-instances run from 2 to 3, labelled using Instancing
2.
Units of measurement are %.
| Maximum | 99.8715 |
| Decile 9 | 64.8687 |
| Decile 8 | 62.3657 |
| Decile 7 | 60.5694 |
| Decile 6 | 59.0164 |
| Median | 57.5446 |
| Decile 4 | 56.0303 |
| Decile 3 | 54.3996 |
| Decile 2 | 52.3667 |
| Decile 1 | 49.3847 |
| Minimum | 0.0626763 |
|
|
- Mean = 57.1927
- Std.dev = 6.48258
- 395 items below graph minimum of 33.9007
- 10 items above graph maximum of 80.3527
|
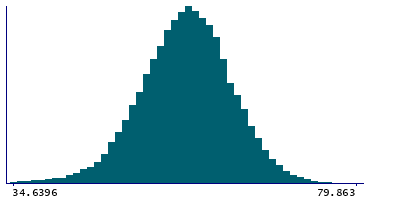
2 Instances
Instance 2 : Imaging visit (2014+)
80,890 participants, 80,890 items
| Maximum | 99.8715 |
| Decile 9 | 64.9196 |
| Decile 8 | 62.4075 |
| Decile 7 | 60.6044 |
| Decile 6 | 59.0498 |
| Median | 57.5802 |
| Decile 4 | 56.0566 |
| Decile 3 | 54.431 |
| Decile 2 | 52.3793 |
| Decile 1 | 49.3778 |
| Minimum | 0.0626763 |
|

|
- Mean = 57.2174
- Std.dev = 6.50609
- 372 items below graph minimum of 33.8361
- 9 items above graph maximum of 80.4613
|
Instance 3 : First repeat imaging visit (2019+)
4,989 participants, 4,989 items
| Maximum | 77.9634 |
| Decile 9 | 64.117 |
| Decile 8 | 61.7336 |
| Decile 7 | 60.0344 |
| Decile 6 | 58.4648 |
| Median | 57.0185 |
| Decile 4 | 55.5736 |
| Decile 3 | 53.9779 |
| Decile 2 | 52.1762 |
| Decile 1 | 49.4822 |
| Minimum | 9.1527 |
|
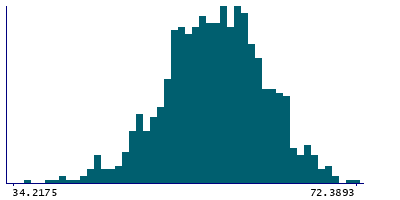
|
- Mean = 56.7914
- Std.dev = 6.07473
- 20 items below graph minimum of 34.8474
|
Notes
Right ventricle ejection fraction
0 Related Data-Fields
There are no related data-fields
0 Resources
There are no matching Resources
