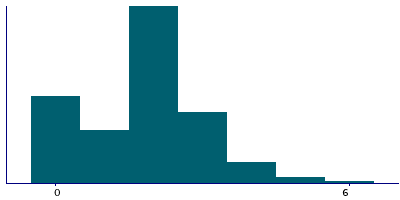
Data
295,089 items of data are available, covering 227,285 participants.
Some values have special meanings defined by Data-Coding
100291.
Defined-instances run from 0 to 3, labelled using Instancing
2.
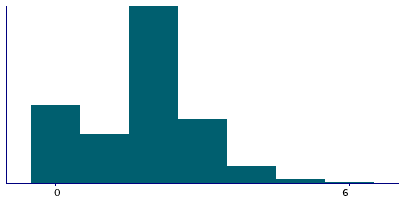
| Maximum | 100 |
| Decile 9 | 3 |
| Decile 8 | 3 |
| Decile 7 | 2 |
| Decile 6 | 2 |
| Median | 2 |
| Decile 4 | 2 |
| Decile 3 | 1 |
| Decile 2 | 0 |
| Decile 1 | 0 |
| Minimum | 0 |
|
|
- There are 37 distinct values.
- Mean = 1.80896
- Std.dev = 1.31725
- 1019 items above graph maximum of 6
- 1219 items have value -3 (Prefer not to answer)
- 1207 items have value -1 (Do not know)
|
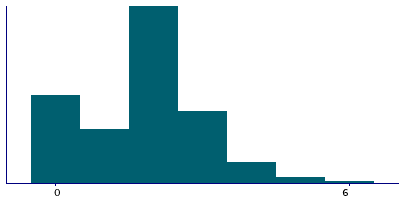
4 Instances
Instance 0 : Initial assessment visit (2006-2010) at which participants were recruited and consent given
226,719 participants, 226,719 items
| Maximum | 100 |
| Decile 9 | 3 |
| Decile 8 | 3 |
| Decile 7 | 2 |
| Decile 6 | 2 |
| Median | 2 |
| Decile 4 | 2 |
| Decile 3 | 1 |
| Decile 2 | 0 |
| Decile 1 | 0 |
| Minimum | 0 |
|
|
- There are 34 distinct values.
- Mean = 1.8142
- Std.dev = 1.33984
- 895 items above graph maximum of 6
- 1060 items have value -3 (Prefer not to answer)
- 1030 items have value -1 (Do not know)
|
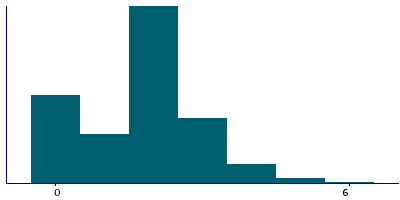
Instance 1 : First repeat assessment visit (2012-13)
9,920 participants, 9,920 items
| Maximum | 11 |
| Decile 9 | 3 |
| Decile 8 | 3 |
| Decile 7 | 2 |
| Decile 6 | 2 |
| Median | 2 |
| Decile 4 | 2 |
| Decile 3 | 1 |
| Decile 2 | 0 |
| Decile 1 | 0 |
| Minimum | 0 |
|
|
- There are 12 distinct values.
- Mean = 1.75565
- Std.dev = 1.21944
- 17 items above graph maximum of 6
- 14 items have value -3 (Prefer not to answer)
- 35 items have value -1 (Do not know)
|
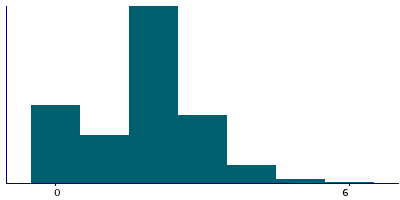
Instance 2 : Imaging visit (2014+)
48,202 participants, 48,202 items
| Maximum | 40 |
| Decile 9 | 3 |
| Decile 8 | 3 |
| Decile 7 | 2 |
| Decile 6 | 2 |
| Median | 2 |
| Decile 4 | 2 |
| Decile 3 | 1 |
| Decile 2 | 0 |
| Decile 1 | 0 |
| Minimum | 0 |
|
|
- There are 21 distinct values.
- Mean = 1.79906
- Std.dev = 1.24187
- 88 items above graph maximum of 6
- 127 items have value -3 (Prefer not to answer)
- 120 items have value -1 (Do not know)
|
Instance 3 : First repeat imaging visit (2019+)
10,248 participants, 10,248 items
| Maximum | 35 |
| Decile 9 | 3 |
| Decile 8 | 3 |
| Decile 7 | 2 |
| Decile 6 | 2 |
| Median | 2 |
| Decile 4 | 2 |
| Decile 3 | 1 |
| Decile 2 | 1 |
| Decile 1 | 0 |
| Minimum | 0 |
|
|
- There are 13 distinct values.
- Mean = 1.79163
- Std.dev = 1.2474
- 19 items above graph maximum of 6
- 18 items have value -3 (Prefer not to answer)
- 22 items have value -1 (Do not know)
|
Notes
ACE touchscreen question "How many children have you fathered?"
The following checks were performed:
- If answer < 0 then rejected
- If answer > 200 then rejected
- If answer > 15 then participant asked to confirm
If the participant activated the Help button they were shown the message:
If you are unsure, please provide an estimate or select Do not know.
|
Coding 100291 defines 2 special values:
- -1 represents "Do not know"
- -3 represents "Prefer not to answer"


