Data
101,360 items of data are available, covering 88,089 participants.
Some values have special meanings defined by Data-Coding
6361.
Defined-instances run from 2 to 3, labelled using Instancing
2.
Units of measurement are attempts.
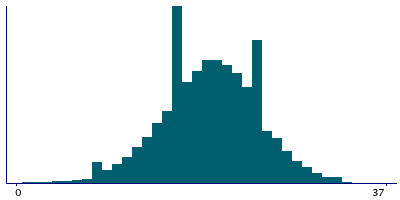
| Maximum | 122 |
| Decile 9 | 25 |
| Decile 8 | 24 |
| Decile 7 | 22 |
| Decile 6 | 21 |
| Median | 19 |
| Decile 4 | 18 |
| Decile 3 | 17 |
| Decile 2 | 16 |
| Decile 1 | 13 |
| Minimum | 1 |
|
|
- There are 73 distinct values.
- Mean = 19.3152
- Std.dev = 4.97951
- 92 items above graph maximum of 37
|
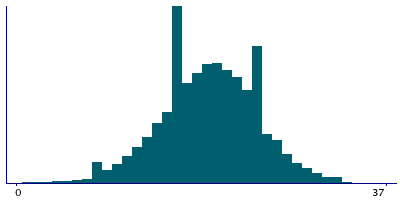
2 Instances
Instance 2 : Imaging visit (2014+)
81,588 participants, 81,588 items
| Maximum | 122 |
| Decile 9 | 25 |
| Decile 8 | 24 |
| Decile 7 | 22 |
| Decile 6 | 21 |
| Median | 19 |
| Decile 4 | 18 |
| Decile 3 | 16 |
| Decile 2 | 16 |
| Decile 1 | 13 |
| Minimum | 1 |
|
|
- There are 66 distinct values.
- Mean = 19.2683
- Std.dev = 4.98041
- 77 items above graph maximum of 37
|
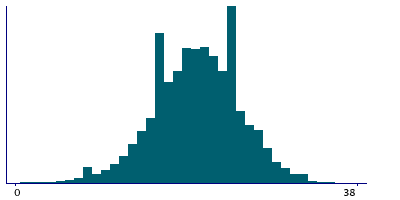
Instance 3 : First repeat imaging visit (2019+)
19,772 participants, 19,772 items
| Maximum | 111 |
| Decile 9 | 25 |
| Decile 8 | 24 |
| Decile 7 | 22 |
| Decile 6 | 21 |
| Median | 20 |
| Decile 4 | 18 |
| Decile 3 | 17 |
| Decile 2 | 16 |
| Decile 1 | 14 |
| Minimum | 1 |
|
|
- There are 49 distinct values.
- Mean = 19.509
- Std.dev = 4.97108
- 15 items above graph maximum of 36
|