Data
572,312 items of data are available, covering 492,363 participants.
Defined-instances run from 0 to 3, labelled using Instancing
2.
Units of measurement are percent.
| Maximum | 77.6 |
| Decile 9 | 41.4 |
| Decile 8 | 37.8 |
| Decile 7 | 35.3 |
| Decile 6 | 33.1 |
| Median | 31.2 |
| Decile 4 | 29.2 |
| Decile 3 | 27.1 |
| Decile 2 | 24.7 |
| Decile 1 | 21.1 |
| Minimum | 2 |
|
|
- Mean = 31.1586
- Std.dev = 7.96132
- 126 items above graph maximum of 61.7
|
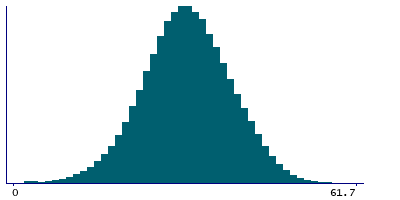
4 Instances
Instance 0 : Initial assessment visit (2006-2010) at which participants were recruited and consent given
491,518 participants, 491,518 items
| Maximum | 77.6 |
| Decile 9 | 41.5 |
| Decile 8 | 37.9 |
| Decile 7 | 35.3 |
| Decile 6 | 33.2 |
| Median | 31.2 |
| Decile 4 | 29.2 |
| Decile 3 | 27.1 |
| Decile 2 | 24.6 |
| Decile 1 | 21.1 |
| Minimum | 2 |
|

|
- Mean = 31.174
- Std.dev = 8.0087
- 112 items above graph maximum of 61.9
|
Instance 1 : First repeat assessment visit (2012-13)
20,022 participants, 20,022 items
| Maximum | 66.4 |
| Decile 9 | 41.2 |
| Decile 8 | 37.7 |
| Decile 7 | 35.2 |
| Decile 6 | 33.2 |
| Median | 31.2 |
| Decile 4 | 29.4 |
| Decile 3 | 27.4 |
| Decile 2 | 24.9 |
| Decile 1 | 21.4 |
| Minimum | 3 |
|

|
- Mean = 31.229
- Std.dev = 7.73551
- 2 items above graph maximum of 61
|
Instance 2 : Imaging visit (2014+)
55,607 participants, 55,607 items
| Maximum | 71.6 |
| Decile 9 | 40.8 |
| Decile 8 | 37.4 |
| Decile 7 | 35 |
| Decile 6 | 33 |
| Median | 31.1 |
| Decile 4 | 29.2 |
| Decile 3 | 27.2 |
| Decile 2 | 24.7 |
| Decile 1 | 21.3 |
| Minimum | 3 |
|

|
- Mean = 31.0062
- Std.dev = 7.64458
- 8 items above graph maximum of 60.3
|
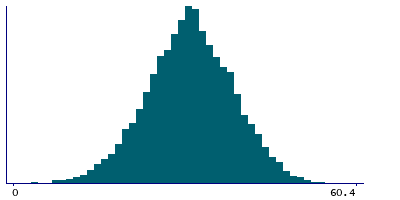
Instance 3 : First repeat imaging visit (2019+)
5,165 participants, 5,165 items
| Maximum | 64.8 |
| Decile 9 | 40.8 |
| Decile 8 | 37.6 |
| Decile 7 | 35 |
| Decile 6 | 32.9 |
| Median | 31.1 |
| Decile 4 | 29.4 |
| Decile 3 | 27.3 |
| Decile 2 | 24.8 |
| Decile 1 | 21.2 |
| Minimum | 3.7 |
|
|
- Mean = 31.0621
- Std.dev = 7.61816
- 2 items above graph maximum of 60.4
|
Notes
Body composition estimation by impedance measurement. Trunk fat percentages
Range 1-75% in 0.1% increments.


