Data
115,441 items of data are available, covering 96,956 participants.
Some values have special meanings defined by Data-Coding
909.
Defined-instances run from 2 to 4, labelled using Instancing
2.
Units of measurement are micrometres.
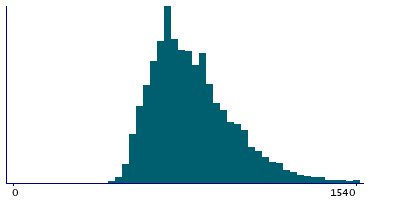
| Maximum | 4700 |
| Decile 9 | 1078 |
| Decile 8 | 962 |
| Decile 7 | 885 |
| Decile 6 | 847 |
| Median | 790 |
| Decile 4 | 731 |
| Decile 3 | 693 |
| Decile 2 | 654 |
| Decile 1 | 616 |
| Minimum | 100 |
|
|
- Mean = 824.551
- Std.dev = 201.008
- 717 items above graph maximum of 1540
- 222 items have value 0 (Measure invalid)
|
2 Instances
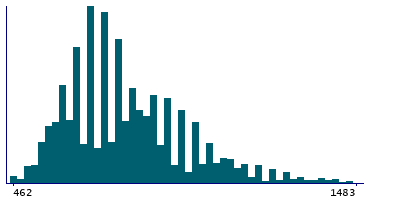
Instance 2 : Imaging visit (2014+)
95,936 participants, 95,738 items
| Maximum | 4700 |
| Decile 9 | 1078 |
| Decile 8 | 962 |
| Decile 7 | 885 |
| Decile 6 | 847 |
| Median | 770 |
| Decile 4 | 731 |
| Decile 3 | 693 |
| Decile 2 | 654 |
| Decile 1 | 616 |
| Minimum | 100 |
|

|
- Mean = 820.69
- Std.dev = 199.189
- 547 items above graph maximum of 1540
- 198 items have value 0 (Measure invalid)
|
Instance 3 : First repeat imaging visit (2019+)
19,475 participants, 19,451 items
| Maximum | 2010 |
| Decile 9 | 1116 |
| Decile 8 | 1001 |
| Decile 7 | 924 |
| Decile 6 | 847 |
| Median | 808 |
| Decile 4 | 770 |
| Decile 3 | 731 |
| Decile 2 | 654 |
| Decile 1 | 616 |
| Minimum | 423 |
|
|
- Mean = 843.418
- Std.dev = 208.649
- 154 items above graph maximum of 1616
- 24 items have value 0 (Measure invalid)
|


