Data
116,293 items of data are available, covering 97,591 participants.
Some values have special meanings defined by Data-Coding
909.
Defined-instances run from 2 to 4, labelled using Instancing
2.
Units of measurement are micrometres.
| Maximum | 2440 |
| Decile 9 | 770 |
| Decile 8 | 693 |
| Decile 7 | 654 |
| Decile 6 | 616 |
| Median | 577 |
| Decile 4 | 539 |
| Decile 3 | 500 |
| Decile 2 | 500 |
| Decile 1 | 423 |
| Minimum | 10 |
|
|
- Mean = 598.883
- Std.dev = 144.391
- 483 items above graph maximum of 1117
- 289 items have value 0 (Measure invalid)
|
2 Instances
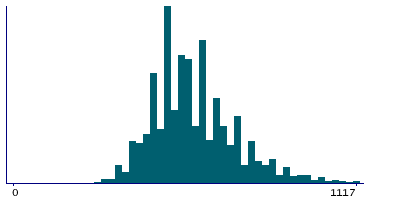
Instance 2 : Imaging visit (2014+)
96,663 participants, 96,398 items
| Maximum | 2440 |
| Decile 9 | 770 |
| Decile 8 | 693 |
| Decile 7 | 654 |
| Decile 6 | 616 |
| Median | 577 |
| Decile 4 | 539 |
| Decile 3 | 500 |
| Decile 2 | 500 |
| Decile 1 | 423 |
| Minimum | 10 |
|

|
- Mean = 597.104
- Std.dev = 143.348
- 390 items above graph maximum of 1117
- 265 items have value 0 (Measure invalid)
|
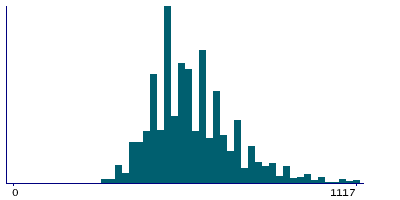
Instance 3 : First repeat imaging visit (2019+)
19,600 participants, 19,576 items
| Maximum | 1732 |
| Decile 9 | 808 |
| Decile 8 | 731 |
| Decile 7 | 654 |
| Decile 6 | 616 |
| Median | 577 |
| Decile 4 | 539 |
| Decile 3 | 539 |
| Decile 2 | 500 |
| Decile 1 | 462 |
| Minimum | 20 |
|
|
- Mean = 607.548
- Std.dev = 149.004
- 93 items above graph maximum of 1154
- 24 items have value 0 (Measure invalid)
|


