Data
116,345 items of data are available, covering 97,584 participants.
Some values have special meanings defined by Data-Coding
909.
Defined-instances run from 2 to 4, labelled using Instancing
2.
Units of measurement are micrometres.
| Maximum | 1930 |
| Decile 9 | 770 |
| Decile 8 | 693 |
| Decile 7 | 654 |
| Decile 6 | 616 |
| Median | 577 |
| Decile 4 | 539 |
| Decile 3 | 500 |
| Decile 2 | 462 |
| Decile 1 | 423 |
| Minimum | 10 |
|

|
- Mean = 586.849
- Std.dev = 134.691
- 268 items above graph maximum of 1117
- 303 items have value 0 (Measure invalid)
|
2 Instances
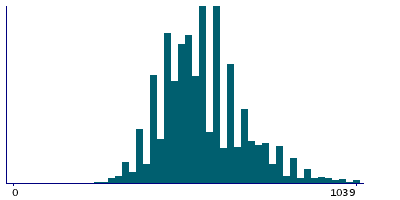
Instance 2 : Imaging visit (2014+)
96,696 participants, 96,413 items
| Maximum | 1930 |
| Decile 9 | 770 |
| Decile 8 | 693 |
| Decile 7 | 650 |
| Decile 6 | 616 |
| Median | 577 |
| Decile 4 | 539 |
| Decile 3 | 500 |
| Decile 2 | 462 |
| Decile 1 | 423 |
| Minimum | 10 |
|
|
- Mean = 584.985
- Std.dev = 133.884
- 215 items above graph maximum of 1117
- 283 items have value 0 (Measure invalid)
|
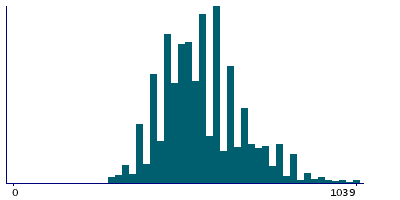
Instance 3 : First repeat imaging visit (2019+)
19,620 participants, 19,600 items
| Maximum | 1886 |
| Decile 9 | 770 |
| Decile 8 | 693 |
| Decile 7 | 654 |
| Decile 6 | 616 |
| Median | 577 |
| Decile 4 | 539 |
| Decile 3 | 500 |
| Decile 2 | 500 |
| Decile 1 | 423 |
| Minimum | 10 |
|
|
- Mean = 596.011
- Std.dev = 138.205
- 53 items above graph maximum of 1117
- 20 items have value 0 (Measure invalid)
|


