Data
115,979 items of data are available, covering 97,343 participants.
Some values have special meanings defined by Data-Coding
909.
Defined-instances run from 2 to 4, labelled using Instancing
2.
Units of measurement are micrometres.
| Maximum | 2680 |
| Decile 9 | 1039 |
| Decile 8 | 962 |
| Decile 7 | 885 |
| Decile 6 | 847 |
| Median | 770 |
| Decile 4 | 731 |
| Decile 3 | 693 |
| Decile 2 | 654 |
| Decile 1 | 616 |
| Minimum | 346 |
|
|
- Mean = 814.549
- Std.dev = 185.484
- 832 items above graph maximum of 1462
- 192 items have value 0 (Measure invalid)
|
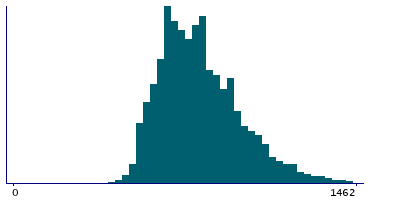
2 Instances
Instance 2 : Imaging visit (2014+)
96,385 participants, 96,205 items
| Maximum | 2680 |
| Decile 9 | 1039 |
| Decile 8 | 962 |
| Decile 7 | 885 |
| Decile 6 | 810 |
| Median | 770 |
| Decile 4 | 731 |
| Decile 3 | 693 |
| Decile 2 | 654 |
| Decile 1 | 616 |
| Minimum | 346 |
|

|
- Mean = 810.661
- Std.dev = 183.373
- 630 items above graph maximum of 1462
- 180 items have value 0 (Measure invalid)
|
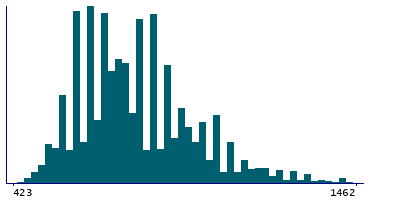
Instance 3 : First repeat imaging visit (2019+)
19,566 participants, 19,554 items
| Maximum | 2050 |
| Decile 9 | 1078 |
| Decile 8 | 962 |
| Decile 7 | 890 |
| Decile 6 | 847 |
| Median | 808 |
| Decile 4 | 770 |
| Decile 3 | 731 |
| Decile 2 | 660 |
| Decile 1 | 616 |
| Minimum | 423 |
|
|
- Mean = 833.652
- Std.dev = 194.383
- 117 items above graph maximum of 1540
- 12 items have value 0 (Measure invalid)
|


