Data
115,979 items of data are available, covering 97,343 participants.
Some values have special meanings defined by Data-Coding
909.
Defined-instances run from 2 to 4, labelled using Instancing
2.
Units of measurement are micrometres.
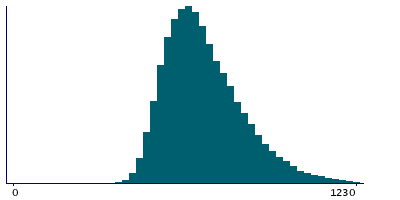
| Maximum | 2073 |
| Decile 9 | 895 |
| Decile 8 | 810 |
| Decile 7 | 755 |
| Decile 6 | 712 |
| Median | 675 |
| Decile 4 | 642 |
| Decile 3 | 609 |
| Decile 2 | 575 |
| Decile 1 | 535 |
| Minimum | 156 |
|
|
- Mean = 699.724
- Std.dev = 149.521
- 512 items above graph maximum of 1255
- 192 items have value 0 (Measure invalid)
|
2 Instances
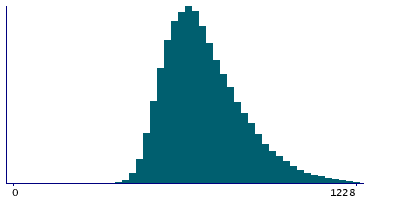
Instance 2 : Imaging visit (2014+)
96,385 participants, 96,205 items
| Maximum | 2073 |
| Decile 9 | 891 |
| Decile 8 | 806 |
| Decile 7 | 752 |
| Decile 6 | 709 |
| Median | 672 |
| Decile 4 | 640 |
| Decile 3 | 607 |
| Decile 2 | 574 |
| Decile 1 | 533 |
| Minimum | 156 |
|
|
- Mean = 696.83
- Std.dev = 148.188
- 419 items above graph maximum of 1249
- 180 items have value 0 (Measure invalid)
|
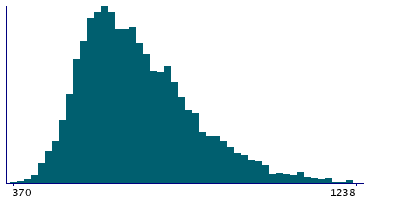
Instance 3 : First repeat imaging visit (2019+)
19,566 participants, 19,554 items
| Maximum | 1820 |
| Decile 9 | 915 |
| Decile 8 | 827 |
| Decile 7 | 773 |
| Decile 6 | 726 |
| Median | 688 |
| Decile 4 | 654 |
| Decile 3 | 620 |
| Decile 2 | 585 |
| Decile 1 | 543 |
| Minimum | 370 |
|
|
- Mean = 713.956
- Std.dev = 155.125
- 100 items above graph maximum of 1287
- 12 items have value 0 (Measure invalid)
|


