Data
50,584 items of data are available, covering 46,667 participants.
Defined-instances run from 2 to 3, labelled using Instancing
2.
Units of measurement are units.
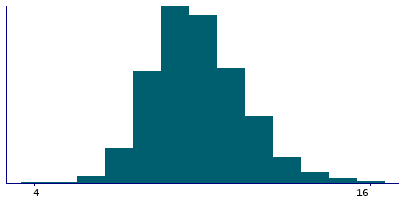
| Maximum | 26 |
| Decile 9 | 12 |
| Decile 8 | 11 |
| Decile 7 | 11 |
| Decile 6 | 10 |
| Median | 10 |
| Decile 4 | 10 |
| Decile 3 | 9 |
| Decile 2 | 9 |
| Decile 1 | 8 |
| Minimum | 1 |
|
|
- There are 24 distinct values.
- Mean = 10.0607
- Std.dev = 1.82075
- 53 items below graph minimum of 4
- 154 items above graph maximum of 16
|
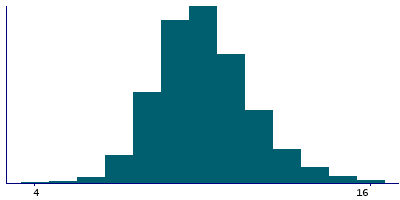
2 Instances
Instance 2 : Imaging visit (2014+)
46,392 participants, 46,392 items
| Maximum | 26 |
| Decile 9 | 12 |
| Decile 8 | 11 |
| Decile 7 | 11 |
| Decile 6 | 10 |
| Median | 10 |
| Decile 4 | 10 |
| Decile 3 | 9 |
| Decile 2 | 9 |
| Decile 1 | 8 |
| Minimum | 1 |
|
|
- There are 24 distinct values.
- Mean = 10.0834
- Std.dev = 1.828
- 49 items below graph minimum of 4
- 148 items above graph maximum of 16
|
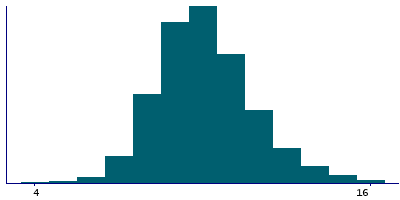
Instance 3 : First repeat imaging visit (2019+)
4,192 participants, 4,192 items
| Maximum | 18 |
| Decile 9 | 12 |
| Decile 8 | 11 |
| Decile 7 | 11 |
| Decile 6 | 10 |
| Median | 10 |
| Decile 4 | 9 |
| Decile 3 | 9 |
| Decile 2 | 8 |
| Decile 1 | 8 |
| Minimum | 1 |
|
|
- There are 17 distinct values.
- Mean = 9.80892
- Std.dev = 1.7185
- 4 items below graph minimum of 4
- 6 items above graph maximum of 16
|