Data
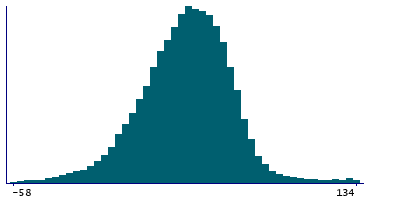
50,584 items of data are available, covering 46,667 participants.
Defined-instances run from 2 to 3, labelled using Instancing
2.
Units of measurement are degrees.
| Maximum | 270 |
| Decile 9 | 70 |
| Decile 8 | 60 |
| Decile 7 | 53 |
| Decile 6 | 47 |
| Median | 41 |
| Decile 4 | 34 |
| Decile 3 | 27 |
| Decile 2 | 19 |
| Decile 1 | 6 |
| Minimum | -90 |
|

|
- There are 355 distinct values.
- Mean = 41.4444
- Std.dev = 33.6051
- 164 items below graph minimum of -58
- 1291 items above graph maximum of 134
|
2 Instances
Instance 2 : Imaging visit (2014+)
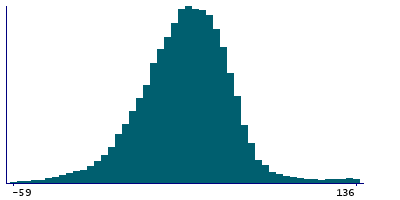
46,392 participants, 46,392 items
| Maximum | 270 |
| Decile 9 | 71 |
| Decile 8 | 60 |
| Decile 7 | 53 |
| Decile 6 | 47 |
| Median | 41 |
| Decile 4 | 34 |
| Decile 3 | 27 |
| Decile 2 | 19 |
| Decile 1 | 6 |
| Minimum | -90 |
|

|
- There are 355 distinct values.
- Mean = 41.5482
- Std.dev = 34.0745
- 153 items below graph minimum of -59
- 1200 items above graph maximum of 136
|
Instance 3 : First repeat imaging visit (2019+)
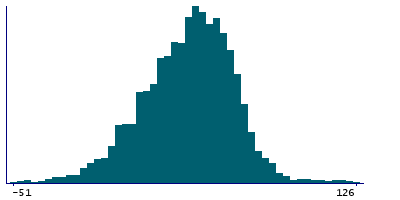
4,192 participants, 4,192 items
| Maximum | 267 |
| Decile 9 | 67 |
| Decile 8 | 59 |
| Decile 7 | 53 |
| Decile 6 | 47 |
| Median | 41 |
| Decile 4 | 35 |
| Decile 3 | 28 |
| Decile 2 | 20 |
| Decile 1 | 8 |
| Minimum | -89 |
|

|
- There are 210 distinct values.
- Mean = 40.2956
- Std.dev = 27.8618
- 7 items below graph minimum of -51
- 48 items above graph maximum of 126
|


