Data
48,027 items of data are available, covering 44,363 participants.
Defined-instances run from 2 to 3, labelled using Instancing
2.
Units of measurement are degrees.
| Maximum | 268 |
| Decile 9 | 74 |
| Decile 8 | 68 |
| Decile 7 | 63 |
| Decile 6 | 59 |
| Median | 54 |
| Decile 4 | 49 |
| Decile 3 | 42 |
| Decile 2 | 33 |
| Decile 1 | 19 |
| Minimum | -90 |
|

|
- There are 197 distinct values.
- Mean = 50.2056
- Std.dev = 23.1449
- 18 items below graph minimum of -36
- 44 items above graph maximum of 129
|
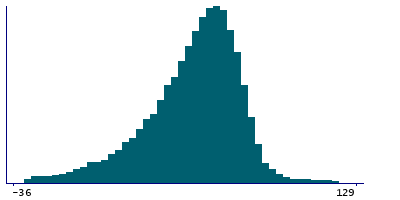
2 Instances
Instance 2 : Imaging visit (2014+)
43,986 participants, 43,986 items
| Maximum | 268 |
| Decile 9 | 74 |
| Decile 8 | 68 |
| Decile 7 | 63 |
| Decile 6 | 59 |
| Median | 54 |
| Decile 4 | 49 |
| Decile 3 | 42 |
| Decile 2 | 33 |
| Decile 1 | 19 |
| Minimum | -90 |
|
|
- There are 195 distinct values.
- Mean = 50.1936
- Std.dev = 23.2234
- 16 items below graph minimum of -36
- 43 items above graph maximum of 129
|
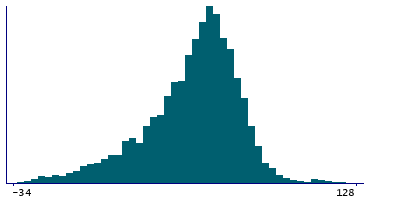
Instance 3 : First repeat imaging visit (2019+)
4,041 participants, 4,041 items
| Maximum | 149 |
| Decile 9 | 74 |
| Decile 8 | 68 |
| Decile 7 | 63 |
| Decile 6 | 59 |
| Median | 54 |
| Decile 4 | 49 |
| Decile 3 | 43 |
| Decile 2 | 34 |
| Decile 1 | 20 |
| Minimum | -68 |
|
|
- There are 142 distinct values.
- Mean = 50.3356
- Std.dev = 22.2717
- 2 items below graph minimum of -34
- 1 item above graph maximum of 128
|