Data
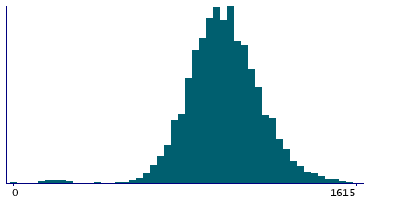
50,584 items of data are available, covering 46,667 participants.
Defined-instances run from 2 to 3, labelled using Instancing
2.
Units of measurement are ms.
| Maximum | 4285 |
| Decile 9 | 1200 |
| Decile 8 | 1130 |
| Decile 7 | 1070 |
| Decile 6 | 1030 |
| Median | 980 |
| Decile 4 | 950 |
| Decile 3 | 905 |
| Decile 2 | 855 |
| Decile 1 | 785 |
| Minimum | 0 |
|

|
- There are 153 distinct values.
- Mean = 990.844
- Std.dev = 183.229
- 103 items above graph maximum of 1615
|
2 Instances
Instance 2 : Imaging visit (2014+)
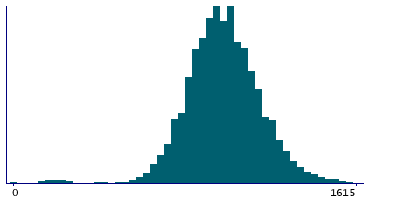
46,392 participants, 46,392 items
| Maximum | 4285 |
| Decile 9 | 1200 |
| Decile 8 | 1130 |
| Decile 7 | 1070 |
| Decile 6 | 1030 |
| Median | 980 |
| Decile 4 | 950 |
| Decile 3 | 905 |
| Decile 2 | 855 |
| Decile 1 | 785 |
| Minimum | 0 |
|

|
- There are 151 distinct values.
- Mean = 988.524
- Std.dev = 182.976
- 93 items above graph maximum of 1615
|
Instance 3 : First repeat imaging visit (2019+)
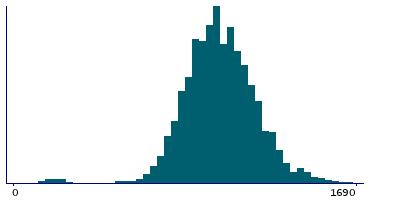
4,192 participants, 4,192 items
| Maximum | 2605 |
| Decile 9 | 1250 |
| Decile 8 | 1150 |
| Decile 7 | 1110 |
| Decile 6 | 1050 |
| Median | 1015 |
| Decile 4 | 965 |
| Decile 3 | 920 |
| Decile 2 | 880 |
| Decile 1 | 810 |
| Minimum | 0 |
|

|
- There are 95 distinct values.
- Mean = 1016.53
- Std.dev = 184.068
- 5 items above graph maximum of 1690
|
Notes
PP interval during ECG
0 Related Data-Fields
There are no related data-fields


