Data
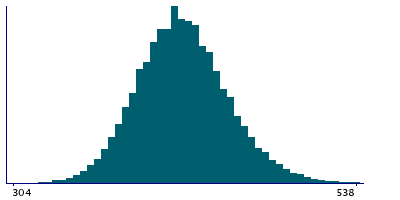
50,584 items of data are available, covering 46,667 participants.
Defined-instances run from 2 to 3, labelled using Instancing
2.
Units of measurement are ms.
| Maximum | 752 |
| Decile 9 | 460 |
| Decile 8 | 444 |
| Decile 7 | 434 |
| Decile 6 | 426 |
| Median | 418 |
| Decile 4 | 410 |
| Decile 3 | 402 |
| Decile 2 | 394 |
| Decile 1 | 382 |
| Minimum | 114 |
|

|
- There are 191 distinct values.
- Mean = 419.581
- Std.dev = 32.1517
- 35 items below graph minimum of 304
- 89 items above graph maximum of 538
|
2 Instances
Instance 2 : Imaging visit (2014+)
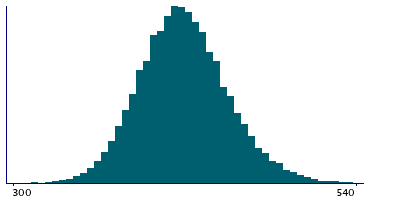
46,392 participants, 46,392 items
| Maximum | 752 |
| Decile 9 | 460 |
| Decile 8 | 444 |
| Decile 7 | 434 |
| Decile 6 | 426 |
| Median | 418 |
| Decile 4 | 410 |
| Decile 3 | 402 |
| Decile 2 | 394 |
| Decile 1 | 380 |
| Minimum | 114 |
|

|
- There are 189 distinct values.
- Mean = 419.086
- Std.dev = 32.1409
- 31 items below graph minimum of 300
- 78 items above graph maximum of 540
|
Instance 3 : First repeat imaging visit (2019+)
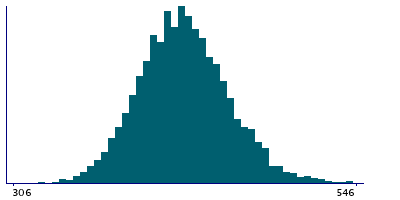
4,192 participants, 4,192 items
| Maximum | 638 |
| Decile 9 | 466 |
| Decile 8 | 450 |
| Decile 7 | 440 |
| Decile 6 | 432 |
| Median | 424 |
| Decile 4 | 416 |
| Decile 3 | 408 |
| Decile 2 | 398 |
| Decile 1 | 386 |
| Minimum | 128 |
|

|
- There are 104 distinct values.
- Mean = 425.062
- Std.dev = 31.7599
- 1 item below graph minimum of 306
- 4 items above graph maximum of 546
|
Notes
QT interval during ECG
0 Related Data-Fields
There are no related data-fields


