Data
122,362 items of data are available, covering 101,638 participants.
Defined-instances run from 2 to 3, labelled using Instancing
2.
Units of measurement are seconds.
| Maximum | 6253 |
| Decile 9 | 699 |
| Decile 8 | 435 |
| Decile 7 | 230 |
| Decile 6 | 118 |
| Median | 86 |
| Decile 4 | 75 |
| Decile 3 | 68 |
| Decile 2 | 63 |
| Decile 1 | 53 |
| Minimum | 4 |
|
|
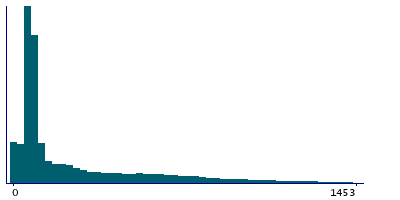
- There are 1863 distinct values.
- Mean = 242.724
- Std.dev = 306.289
- 1181 items above graph maximum of 1345
|
2 Instances
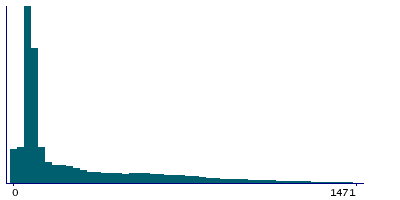
Instance 2 : Imaging visit (2014+)
101,308 participants, 101,308 items
| Maximum | 6253 |
| Decile 9 | 740 |
| Decile 8 | 501 |
| Decile 7 | 285 |
| Decile 6 | 149 |
| Median | 92 |
| Decile 4 | 77 |
| Decile 3 | 69 |
| Decile 2 | 64 |
| Decile 1 | 56 |
| Minimum | 4 |
|
|
- There are 1824 distinct values.
- Mean = 264.993
- Std.dev = 318.396
- 758 items above graph maximum of 1424
|
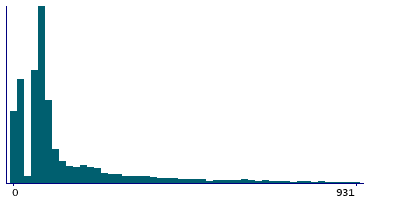
Instance 3 : First repeat imaging visit (2019+)
21,054 participants, 21,054 items
| Maximum | 3790 |
| Decile 9 | 281 |
| Decile 8 | 142 |
| Decile 7 | 94 |
| Decile 6 | 82 |
| Median | 75 |
| Decile 4 | 69 |
| Decile 3 | 65 |
| Decile 2 | 59 |
| Decile 1 | 14 |
| Minimum | 4 |
|
|
- There are 1110 distinct values.
- Mean = 135.568
- Std.dev = 208.692
- 966 items above graph maximum of 548
|
Notes
ECG at rest duration
0 Related Data-Fields
There are no related data-fields
0 Resources
There are no matching Resources
