Data
122,501 items of data are available, covering 101,595 participants.
Defined-instances run from 2 to 3, labelled using Instancing
2.
Units of measurement are seconds.
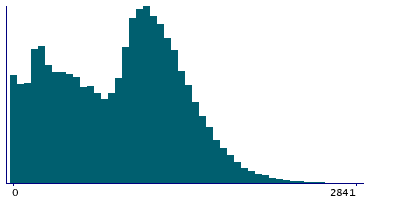
| Maximum | 9591 |
| Decile 9 | 1499 |
| Decile 8 | 1318 |
| Decile 7 | 1189 |
| Decile 6 | 1077 |
| Median | 967 |
| Decile 4 | 798 |
| Decile 3 | 560 |
| Decile 2 | 351 |
| Decile 1 | 174 |
| Minimum | 4 |
|
|
- There are 2467 distinct values.
- Mean = 887.95
- Std.dev = 503.929
- 41 items above graph maximum of 2824
|
2 Instances
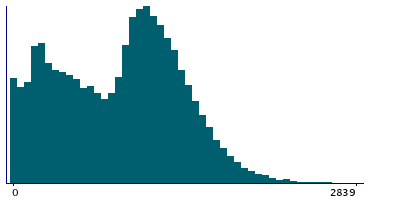
Instance 2 : Imaging visit (2014+)
101,475 participants, 101,475 items
| Maximum | 9591 |
| Decile 9 | 1506 |
| Decile 8 | 1326 |
| Decile 7 | 1197 |
| Decile 6 | 1086 |
| Median | 979 |
| Decile 4 | 831 |
| Decile 3 | 590 |
| Decile 2 | 366 |
| Decile 1 | 178 |
| Minimum | 4 |
|
|
- There are 2436 distinct values.
- Mean = 900.47
- Std.dev = 502.498
- 33 items above graph maximum of 2834
|
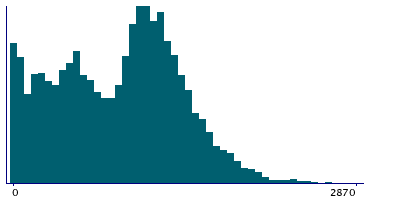
Instance 3 : First repeat imaging visit (2019+)
21,026 participants, 21,026 items
| Maximum | 5269 |
| Decile 9 | 1456.5 |
| Decile 8 | 1275 |
| Decile 7 | 1151 |
| Decile 6 | 1033 |
| Median | 878 |
| Decile 4 | 643.5 |
| Decile 3 | 462 |
| Decile 2 | 301 |
| Decile 1 | 154 |
| Minimum | 5 |
|
|
- There are 2077 distinct values.
- Mean = 827.528
- Std.dev = 506.449
- 8 items above graph maximum of 2759
|
Notes
DXA assessment duration
0 Related Data-Fields
There are no related data-fields
0 Resources
There are no matching Resources
