Data
122,843 items of data are available, covering 101,791 participants.
Defined-instances run from 2 to 3, labelled using Instancing
2.
Units of measurement are seconds.
| Maximum | 48688 |
| Decile 9 | 100 |
| Decile 8 | 72 |
| Decile 7 | 58 |
| Decile 6 | 49 |
| Median | 41 |
| Decile 4 | 34 |
| Decile 3 | 28 |
| Decile 2 | 23 |
| Decile 1 | 18 |
| Minimum | 7 |
|
|
- There are 788 distinct values.
- Mean = 57.5347
- Std.dev = 240.033
- 3366 items above graph maximum of 182
|
2 Instances
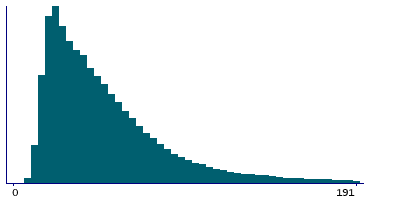
Instance 2 : Imaging visit (2014+)
101,785 participants, 101,785 items
| Maximum | 48688 |
| Decile 9 | 105 |
| Decile 8 | 76 |
| Decile 7 | 62 |
| Decile 6 | 52 |
| Median | 44 |
| Decile 4 | 37 |
| Decile 3 | 30 |
| Decile 2 | 25 |
| Decile 1 | 19 |
| Minimum | 7 |
|

|
- There are 761 distinct values.
- Mean = 60.4438
- Std.dev = 176.786
- 2799 items above graph maximum of 191
|
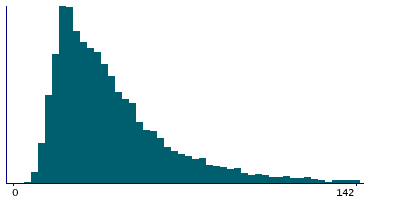
Instance 3 : First repeat imaging visit (2019+)
21,058 participants, 21,058 items
| Maximum | 44599 |
| Decile 9 | 68 |
| Decile 8 | 50 |
| Decile 7 | 40 |
| Decile 6 | 34 |
| Median | 29 |
| Decile 4 | 24 |
| Decile 3 | 21 |
| Decile 2 | 17 |
| Decile 1 | 14 |
| Minimum | 7 |
|
|
- There are 351 distinct values.
- Mean = 43.4737
- Std.dev = 429.886
- 563 items above graph maximum of 122
|
Notes
Conclusion duration
0 Related Data-Fields
There are no related data-fields
0 Resources
There are no matching Resources
