Data
121,706 items of data are available, covering 100,943 participants.
Defined-instances run from 2 to 3, labelled using Instancing
2.
Units of measurement are seconds.
| Maximum | 5278 |
| Decile 9 | 456 |
| Decile 8 | 366 |
| Decile 7 | 314 |
| Decile 6 | 276 |
| Median | 245 |
| Decile 4 | 217 |
| Decile 3 | 191 |
| Decile 2 | 166 |
| Decile 1 | 137 |
| Minimum | 10 |
|

|
- There are 1320 distinct values.
- Mean = 278.234
- Std.dev = 158.623
- 1938 items above graph maximum of 775
|
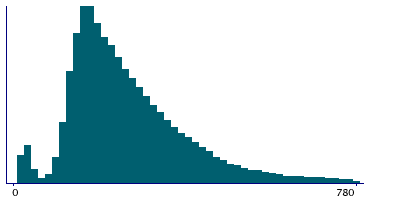
2 Instances
Instance 2 : Imaging visit (2014+)
100,744 participants, 100,744 items
| Maximum | 5278 |
| Decile 9 | 455 |
| Decile 8 | 366 |
| Decile 7 | 314 |
| Decile 6 | 276 |
| Median | 244 |
| Decile 4 | 215 |
| Decile 3 | 188 |
| Decile 2 | 163 |
| Decile 1 | 135 |
| Minimum | 10 |
|
|
- There are 1290 distinct values.
- Mean = 276.88
- Std.dev = 159.27
- 1581 items above graph maximum of 775
|
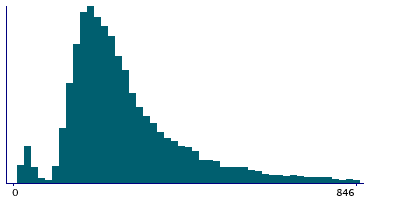
Instance 3 : First repeat imaging visit (2019+)
20,962 participants, 20,962 items
| Maximum | 2340 |
| Decile 9 | 464 |
| Decile 8 | 366 |
| Decile 7 | 313 |
| Decile 6 | 276 |
| Median | 249 |
| Decile 4 | 225 |
| Decile 3 | 203 |
| Decile 2 | 180 |
| Decile 1 | 152 |
| Minimum | 10 |
|
|
- There are 988 distinct values.
- Mean = 284.743
- Std.dev = 155.312
- 357 items above graph maximum of 776
|
Notes
Sample collection duration
0 Related Data-Fields
There are no related data-fields
0 Resources
There are no matching Resources
