Data
122,877 items of data are available, covering 101,814 participants.
Defined-instances run from 2 to 3, labelled using Instancing
2.
Units of measurement are seconds.
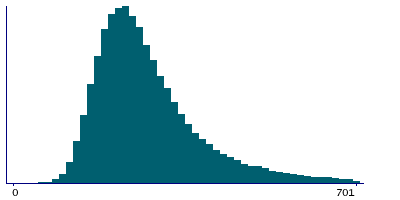
| Maximum | 180825 |
| Decile 9 | 414 |
| Decile 8 | 339 |
| Decile 7 | 299 |
| Decile 6 | 271 |
| Median | 248 |
| Decile 4 | 228 |
| Decile 3 | 209 |
| Decile 2 | 188 |
| Decile 1 | 164 |
| Minimum | 30 |
|
|
- There are 1091 distinct values.
- Mean = 276.276
- Std.dev = 528.749
- 1708 items above graph maximum of 664
|
2 Instances
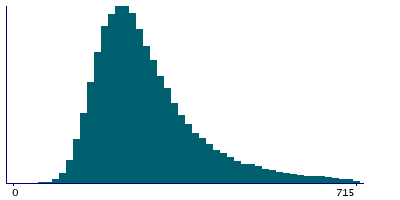
Instance 2 : Imaging visit (2014+)
101,813 participants, 101,813 items
| Maximum | 180825 |
| Decile 9 | 427 |
| Decile 8 | 348 |
| Decile 7 | 306 |
| Decile 6 | 277 |
| Median | 253 |
| Decile 4 | 233 |
| Decile 3 | 213 |
| Decile 2 | 192 |
| Decile 1 | 167 |
| Minimum | 30 |
|
|
- There are 1071 distinct values.
- Mean = 283.063
- Std.dev = 579.057
- 1344 items above graph maximum of 687
|
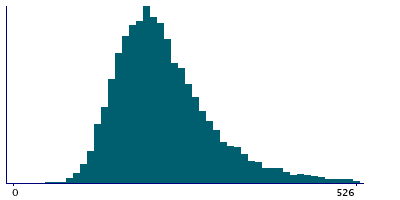
Instance 3 : First repeat imaging visit (2019+)
21,064 participants, 21,064 items
| Maximum | 1547 |
| Decile 9 | 351 |
| Decile 8 | 298 |
| Decile 7 | 268 |
| Decile 6 | 245 |
| Median | 226 |
| Decile 4 | 209 |
| Decile 3 | 192 |
| Decile 2 | 174 |
| Decile 1 | 153 |
| Minimum | 35 |
|
|
- There are 649 distinct values.
- Mean = 243.47
- Std.dev = 94.32
- 230 items above graph maximum of 549
|
Notes
The time taken to perform the consent process at the imaging clinics.
0 Related Data-Fields
There are no related data-fields
0 Resources
There are no matching Resources
