Data
122,910 items of data are available, covering 101,843 participants.
Defined-instances run from 2 to 3, labelled using Instancing
2.
Units of measurement are seconds.
| Maximum | 6582 |
| Decile 9 | 92 |
| Decile 8 | 67 |
| Decile 7 | 54 |
| Decile 6 | 44 |
| Median | 36 |
| Decile 4 | 29 |
| Decile 3 | 25 |
| Decile 2 | 20 |
| Decile 1 | 16 |
| Minimum | 2 |
|
|
- There are 815 distinct values.
- Mean = 51.3083
- Std.dev = 81.3182
- 2942 items above graph maximum of 168
|
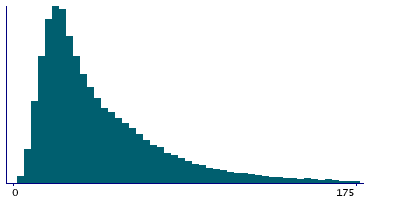
2 Instances
Instance 2 : Imaging visit (2014+)
101,843 participants, 101,843 items
| Maximum | 6582 |
| Decile 9 | 94 |
| Decile 8 | 68 |
| Decile 7 | 55 |
| Decile 6 | 45 |
| Median | 37 |
| Decile 4 | 30 |
| Decile 3 | 25 |
| Decile 2 | 21 |
| Decile 1 | 16 |
| Minimum | 2 |
|

|
- There are 729 distinct values.
- Mean = 51.8886
- Std.dev = 80.8527
- 2310 items above graph maximum of 172
|
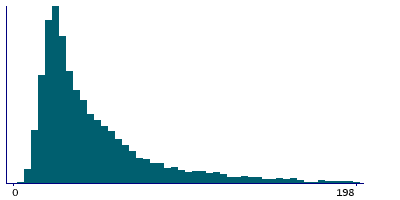
Instance 3 : First repeat imaging visit (2019+)
21,067 participants, 21,067 items
| Maximum | 3633 |
| Decile 9 | 85 |
| Decile 8 | 61 |
| Decile 7 | 48 |
| Decile 6 | 38 |
| Median | 30 |
| Decile 4 | 26 |
| Decile 3 | 22 |
| Decile 2 | 18 |
| Decile 1 | 15 |
| Minimum | 3 |
|
|
- There are 450 distinct values.
- Mean = 48.5032
- Std.dev = 83.475
- 605 items above graph maximum of 155
|
Notes
Reception duration
0 Related Data-Fields
There are no related data-fields
0 Resources
There are no matching Resources
