Data
33,709 items of data are available, covering 32,824 participants.
Defined-instances run from 2 to 3, labelled using Instancing
2.
Units of measurement are g.
| Maximum | 1049 |
| Decile 9 | 656 |
| Decile 8 | 605 |
| Decile 7 | 563 |
| Decile 6 | 520 |
| Median | 475 |
| Decile 4 | 435 |
| Decile 3 | 403 |
| Decile 2 | 373 |
| Decile 1 | 340 |
| Minimum | 58 |
|

|
- There are 668 distinct values.
- Mean = 488.817
- Std.dev = 122.371
- 4 items above graph maximum of 972
|
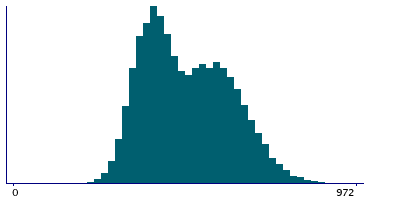
2 Instances
Instance 2 : Imaging visit (2014+)
29,928 participants, 29,928 items
| Maximum | 1049 |
| Decile 9 | 656 |
| Decile 8 | 604 |
| Decile 7 | 562 |
| Decile 6 | 520 |
| Median | 474 |
| Decile 4 | 435 |
| Decile 3 | 403 |
| Decile 2 | 374 |
| Decile 1 | 340 |
| Minimum | 58 |
|
|
- There are 665 distinct values.
- Mean = 488.524
- Std.dev = 122.254
- 4 items above graph maximum of 972
|
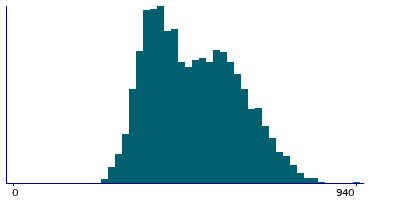
Instance 3 : First repeat imaging visit (2019+)
3,781 participants, 3,781 items
| Maximum | 940 |
| Decile 9 | 660 |
| Decile 8 | 606 |
| Decile 7 | 567.5 |
| Decile 6 | 524 |
| Median | 480.5 |
| Decile 4 | 440 |
| Decile 3 | 403 |
| Decile 2 | 373 |
| Decile 1 | 339 |
| Minimum | 199 |
|
|
- There are 533 distinct values.
- Mean = 491.136
- Std.dev = 123.276
|
Notes
Value output by DXA system. Field 21128 Leg bone mass (right) was originally incorrectly named as Leg fat free mass (right), corrected Q2 2024.
1 Related Data-Field
| Field ID | Description | Relationship |
|---|
| 21125 | Leg bone mass (left) | Field 21125 is the opposite-side complement to Current Field |
0 Resources
There are no matching Resources
