Data
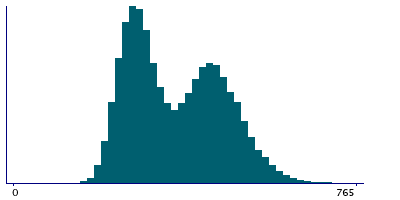
71,730 items of data are available, covering 67,287 participants.
Defined-instances run from 2 to 3, labelled using Instancing
2.
Units of measurement are g.
| Maximum | 772 |
| Decile 9 | 500 |
| Decile 8 | 460 |
| Decile 7 | 429 |
| Decile 6 | 393 |
| Median | 344 |
| Decile 4 | 304 |
| Decile 3 | 280 |
| Decile 2 | 259 |
| Decile 1 | 235 |
| Minimum | 0 |
|
|
- There are 581 distinct values.
- Mean = 359.123
- Std.dev = 103.919
- 1 item above graph maximum of 765
|
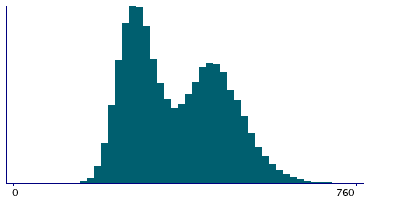
2 Instances
Instance 2 : Imaging visit (2014+)
65,369 participants, 65,369 items
| Maximum | 760 |
| Decile 9 | 500 |
| Decile 8 | 460 |
| Decile 7 | 428 |
| Decile 6 | 392 |
| Median | 343 |
| Decile 4 | 304 |
| Decile 3 | 279 |
| Decile 2 | 258 |
| Decile 1 | 235 |
| Minimum | 0 |
|
|
- There are 576 distinct values.
- Mean = 358.836
- Std.dev = 103.933
|
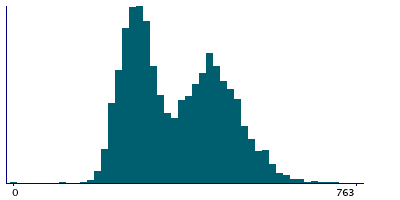
Instance 3 : First repeat imaging visit (2019+)
6,361 participants, 6,361 items
| Maximum | 772 |
| Decile 9 | 501 |
| Decile 8 | 463 |
| Decile 7 | 433 |
| Decile 6 | 398 |
| Median | 350 |
| Decile 4 | 307 |
| Decile 3 | 283 |
| Decile 2 | 261 |
| Decile 1 | 237 |
| Minimum | 0 |
|
|
- There are 469 distinct values.
- Mean = 362.082
- Std.dev = 103.724
- 1 item above graph maximum of 765
|
Notes
Value output by DXA system
0 Related Data-Fields
There are no related data-fields
0 Resources
There are no matching Resources
