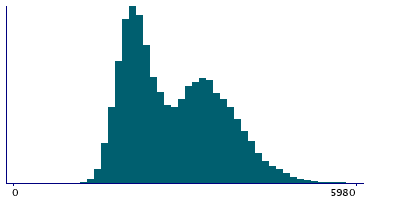
Data
18,915 items of data are available, covering 18,186 participants.
Defined-instances run from 2 to 3, labelled using Instancing
2.
Units of measurement are g.
| Maximum | 6217 |
| Decile 9 | 3924 |
| Decile 8 | 3571 |
| Decile 7 | 3293 |
| Decile 6 | 3019 |
| Median | 2677.5 |
| Decile 4 | 2384 |
| Decile 3 | 2195 |
| Decile 2 | 2039 |
| Decile 1 | 1867.5 |
| Minimum | 365 |
|
|
- There are 3357 distinct values.
- Mean = 2807.71
- Std.dev = 812.611
- 6 items above graph maximum of 5980
|
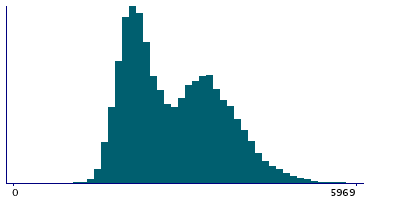
2 Instances
Instance 2 : Imaging visit (2014+)
16,931 participants, 16,931 items
| Maximum | 6217 |
| Decile 9 | 3917 |
| Decile 8 | 3561 |
| Decile 7 | 3292 |
| Decile 6 | 3020 |
| Median | 2676 |
| Decile 4 | 2382 |
| Decile 3 | 2194 |
| Decile 2 | 2035 |
| Decile 1 | 1865 |
| Minimum | 365 |
|
|
- There are 3289 distinct values.
- Mean = 2804.3
- Std.dev = 810.714
- 4 items above graph maximum of 5969
|
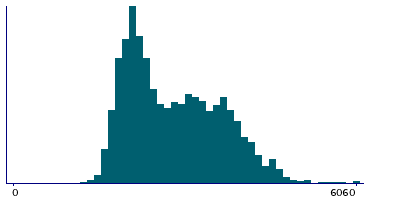
Instance 3 : First repeat imaging visit (2019+)
1,984 participants, 1,984 items
| Maximum | 6060 |
| Decile 9 | 3972 |
| Decile 8 | 3646.5 |
| Decile 7 | 3312 |
| Decile 6 | 3017.5 |
| Median | 2685 |
| Decile 4 | 2401 |
| Decile 3 | 2202 |
| Decile 2 | 2058.5 |
| Decile 1 | 1883.5 |
| Minimum | 1201 |
|
|
- There are 1425 distinct values.
- Mean = 2836.78
- Std.dev = 828.054
|
Notes
Value output by DXA system. Field 21113 Arm fat free mass (left) was originally incorrectly named as Arm bone mass (right), corrected Q2 2024.
1 Related Data-Field
| Field ID | Description | Relationship |
|---|
| 21117 | Arm fat free mass (right) | Current Field is the opposite-side complement to Field 21117 |
0 Resources
There are no matching Resources
