Data
33,709 items of data are available, covering 32,824 participants.
Defined-instances run from 2 to 3, labelled using Instancing
2.
Units of measurement are g.
| Maximum | 380 |
| Decile 9 | 247 |
| Decile 8 | 227 |
| Decile 7 | 211 |
| Decile 6 | 193 |
| Median | 170 |
| Decile 4 | 150 |
| Decile 3 | 138 |
| Decile 2 | 127 |
| Decile 1 | 115 |
| Minimum | 13 |
|
|
- There are 301 distinct values.
- Mean = 176.722
- Std.dev = 51.6761
- 1 item above graph maximum of 379
|
2 Instances
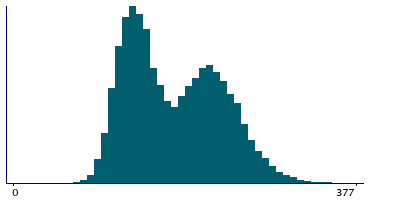
Instance 2 : Imaging visit (2014+)
29,928 participants, 29,928 items
| Maximum | 380 |
| Decile 9 | 247 |
| Decile 8 | 227 |
| Decile 7 | 210 |
| Decile 6 | 193 |
| Median | 170 |
| Decile 4 | 150 |
| Decile 3 | 137 |
| Decile 2 | 127 |
| Decile 1 | 115 |
| Minimum | 13 |
|

|
- There are 297 distinct values.
- Mean = 176.588
- Std.dev = 51.6623
- 1 item above graph maximum of 379
|
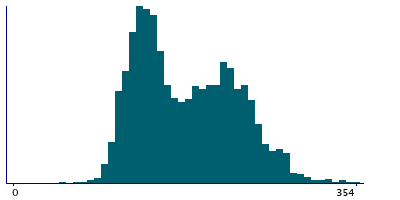
Instance 3 : First repeat imaging visit (2019+)
3,781 participants, 3,781 items
| Maximum | 354 |
| Decile 9 | 246.5 |
| Decile 8 | 228 |
| Decile 7 | 213 |
| Decile 6 | 195 |
| Median | 173 |
| Decile 4 | 151 |
| Decile 3 | 139 |
| Decile 2 | 127 |
| Decile 1 | 114 |
| Minimum | 40 |
|
|
- There are 241 distinct values.
- Mean = 177.783
- Std.dev = 51.7733
|
Notes
Value output by DXA system
1 Related Data-Field
| Field ID | Description | Relationship |
|---|
| 21116 | Arm bone mass (right) | Current Field is the opposite-side complement to Field 21116 |
0 Resources
There are no matching Resources
