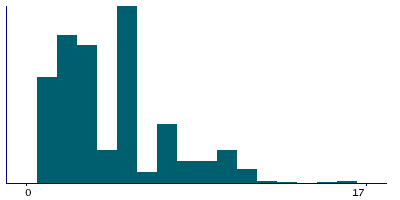
Data
495,609 items of data are available, covering 457,280 participants.
Defined-instances run from 0 to 2, labelled using Instancing
2.
Units of measurement are mg/L.
| Maximum | 36 |
| Decile 9 | 9 |
| Decile 8 | 7 |
| Decile 7 | 5 |
| Decile 6 | 5 |
| Median | 3 |
| Decile 4 | 3 |
| Decile 3 | 2 |
| Decile 2 | 2 |
| Decile 1 | 1 |
| Minimum | 0 |
|
|
- There are 35 distinct values.
- Mean = 4.55537
- Std.dev = 3.79871
- 7772 items above graph maximum of 17
|
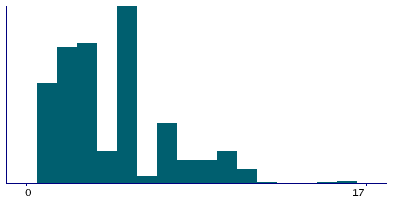
3 Instances
Instance 0 : Initial assessment visit (2006-2010) at which participants were recruited and consent given
455,363 participants, 455,363 items
| Maximum | 36 |
| Decile 9 | 9 |
| Decile 8 | 7 |
| Decile 7 | 5 |
| Decile 6 | 5 |
| Median | 4 |
| Decile 4 | 3 |
| Decile 3 | 2 |
| Decile 2 | 2 |
| Decile 1 | 1 |
| Minimum | 0 |
|
|
- There are 30 distinct values.
- Mean = 4.58371
- Std.dev = 3.75445
- 6591 items above graph maximum of 17
|
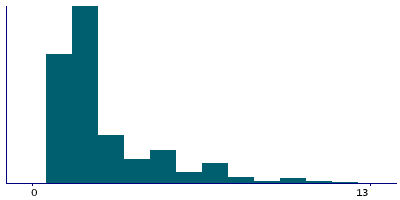
Instance 1 : First repeat assessment visit (2012-13)
20,303 participants, 20,303 items
| Maximum | 32 |
| Decile 9 | 7 |
| Decile 8 | 4 |
| Decile 7 | 3 |
| Decile 6 | 2 |
| Median | 2 |
| Decile 4 | 2 |
| Decile 3 | 2 |
| Decile 2 | 1 |
| Decile 1 | 1 |
| Minimum | 0 |
|
|
- There are 29 distinct values.
- Mean = 3.24504
- Std.dev = 3.7543
- 564 items above graph maximum of 13
|
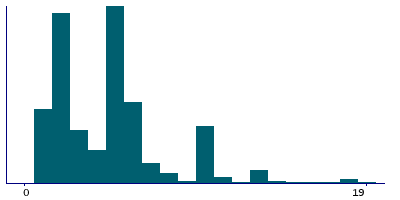
Instance 2 : Imaging visit (2014+)
19,943 participants, 19,943 items
| Maximum | 32 |
| Decile 9 | 10 |
| Decile 8 | 6 |
| Decile 7 | 6 |
| Decile 6 | 5 |
| Median | 5 |
| Decile 4 | 3 |
| Decile 3 | 2 |
| Decile 2 | 2 |
| Decile 1 | 1 |
| Minimum | 0 |
|
|
- There are 33 distinct values.
- Mean = 5.24239
- Std.dev = 4.49068
- 595 items above graph maximum of 19
|
Notes
Domestic water magnesium concentration.
1 Related Data-Field
| Field ID | Description | Relationship |
|---|
| 21102 | Year of survey | Current Field measures are related to a survey year captured in Field 21102 |
0 Resources
There are no matching Resources
