Data
181,943 items of data are available, covering 181,943 participants.
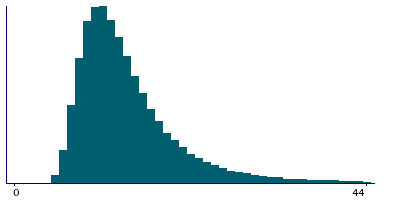
Units of measurement are minutes.
| Maximum | 310147 |
| Decile 9 | 26 |
| Decile 8 | 19 |
| Decile 7 | 16 |
| Decile 6 | 14 |
| Median | 13 |
| Decile 4 | 12 |
| Decile 3 | 11 |
| Decile 2 | 9 |
| Decile 1 | 8 |
| Minimum | 4 |
|
|
- There are 4821 distinct values.
- Mean = 858.067
- Std.dev = 8649.71
- 8521 items above graph maximum of 44
|
Notes
The time participants took to complete the food preferences questionnaire are measured from first starting it to clicking the sign-off button on the final screen. Participants were able to complete the questionnaire over multiple sessions so a long time need not indicate they were continuously connected.
Times are rounded down to the nearest minute.


