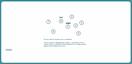
Data
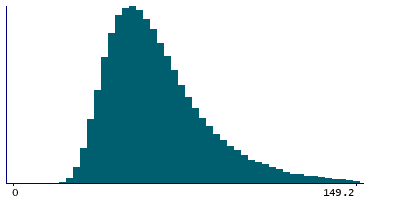
256,499 items of data are available, covering 187,174 participants.
Defined-instances run from 0 to 1, labelled using Instancing
178.
Units of measurement are seconds.
| Maximum | 1159.68 |
| Decile 9 | 94.2835 |
| Decile 8 | 79.3355 |
| Decile 7 | 70.4815 |
| Decile 6 | 64.09 |
| Median | 58.7815 |
| Decile 4 | 54.027 |
| Decile 3 | 49.494 |
| Decile 2 | 44.8425 |
| Decile 1 | 39.352 |
| Minimum | 11.244 |
|
|
- Mean = 63.852
- Std.dev = 24.6089
- 2358 items above graph maximum of 149.215
|
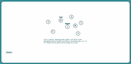
2 Instances
Instance 0 : Assessment run 2014
103,892 participants, 103,892 items
| Maximum | 746.531 |
| Decile 9 | 98.3235 |
| Decile 8 | 82.455 |
| Decile 7 | 73.178 |
| Decile 6 | 66.597 |
| Median | 61.19 |
| Decile 4 | 56.44 |
| Decile 3 | 51.9 |
| Decile 2 | 47.1545 |
| Decile 1 | 41.6245 |
| Minimum | 20.556 |
|

|
- Mean = 66.8099
- Std.dev = 25.758
- 1110 items above graph maximum of 155.022
|
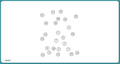
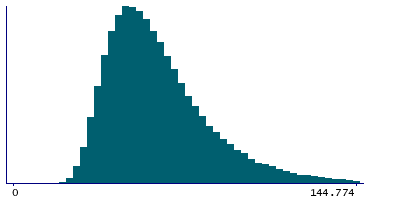
Instance 1 : Assessment run 2021
152,607 participants, 152,607 items
| Maximum | 1159.68 |
| Decile 9 | 91.4315 |
| Decile 8 | 77.114 |
| Decile 7 | 68.619 |
| Decile 6 | 62.3235 |
| Median | 57.0775 |
| Decile 4 | 52.4085 |
| Decile 3 | 47.9285 |
| Decile 2 | 43.394 |
| Decile 1 | 38.064 |
| Minimum | 11.244 |
|
|
- Mean = 61.8383
- Std.dev = 23.5836
- 1143 items above graph maximum of 144.799
|