Data
171,662 items of data are available, covering 93,632 participants.
Defined-instances run from 0 to 1, labelled using Instancing
178.
Array indices run from 1 to 25.
Units of measurement are error-count.
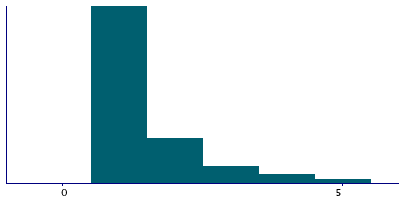
| Maximum | 319 |
| Decile 9 | 3 |
| Decile 8 | 2 |
| Decile 7 | 2 |
| Decile 6 | 1 |
| Median | 1 |
| Decile 4 | 1 |
| Decile 3 | 1 |
| Decile 2 | 1 |
| Decile 1 | 1 |
| Minimum | 1 |
|
|
- There are 56 distinct values.
- Mean = 1.77563
- Std.dev = 2.25483
- 5758 items above graph maximum of 5
|
2 Instances
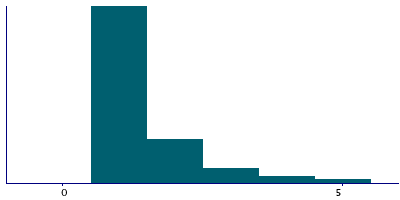
Instance 0 : Assessment run 2014
42,718 participants, 72,241 items
| Maximum | 319 |
| Decile 9 | 3 |
| Decile 8 | 2 |
| Decile 7 | 2 |
| Decile 6 | 1 |
| Median | 1 |
| Decile 4 | 1 |
| Decile 3 | 1 |
| Decile 2 | 1 |
| Decile 1 | 1 |
| Minimum | 1 |
|
|
- There are 56 distinct values.
- Mean = 1.90732
- Std.dev = 3.01696
- 3045 items above graph maximum of 5
|
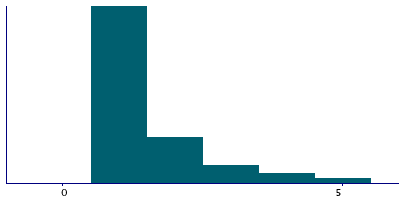
Instance 1 : Assessment run 2021
63,025 participants, 99,421 items
| Maximum | 35 |
| Decile 9 | 3 |
| Decile 8 | 2 |
| Decile 7 | 2 |
| Decile 6 | 1 |
| Median | 1 |
| Decile 4 | 1 |
| Decile 3 | 1 |
| Decile 2 | 1 |
| Decile 1 | 1 |
| Minimum | 1 |
|
|
- There are 31 distinct values.
- Mean = 1.67995
- Std.dev = 1.46395
- 2713 items above graph maximum of 5
|