Data
50,455 items of data are available, covering 49,661 participants.
Defined-instances run from 2 to 3, labelled using Instancing
2.
Units of measurement are letters.
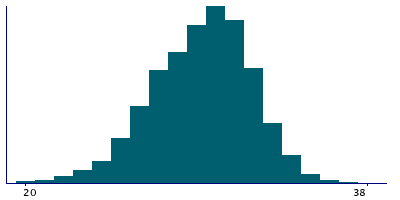
| Maximum | 40 |
| Decile 9 | 32 |
| Decile 8 | 31 |
| Decile 7 | 31 |
| Decile 6 | 30 |
| Median | 30 |
| Decile 4 | 29 |
| Decile 3 | 28 |
| Decile 2 | 27 |
| Decile 1 | 26 |
| Minimum | 1 |
|
|
- There are 38 distinct values.
- Mean = 29.2323
- Std.dev = 2.93006
- 219 items below graph minimum of 20
- 4 items above graph maximum of 38
|
2 Instances
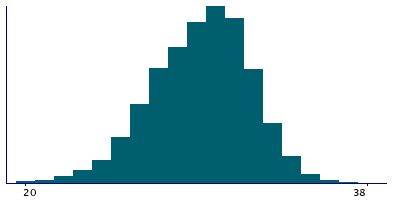
Instance 2 : Imaging visit (2014+)
35,622 participants, 35,622 items
| Maximum | 40 |
| Decile 9 | 32 |
| Decile 8 | 31 |
| Decile 7 | 31 |
| Decile 6 | 30 |
| Median | 30 |
| Decile 4 | 29 |
| Decile 3 | 28 |
| Decile 2 | 27 |
| Decile 1 | 26 |
| Minimum | 1 |
|
|
- There are 38 distinct values.
- Mean = 29.2305
- Std.dev = 2.94363
- 164 items below graph minimum of 20
- 3 items above graph maximum of 38
|
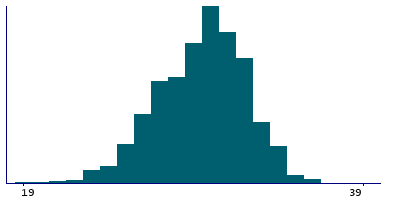
Instance 3 : First repeat imaging visit (2019+)
14,833 participants, 14,833 items
| Maximum | 39 |
| Decile 9 | 32 |
| Decile 8 | 31 |
| Decile 7 | 31 |
| Decile 6 | 30 |
| Median | 30 |
| Decile 4 | 29 |
| Decile 3 | 28 |
| Decile 2 | 27 |
| Decile 1 | 26 |
| Minimum | 1 |
|
|
- There are 34 distinct values.
- Mean = 29.2367
- Std.dev = 2.89721
- 55 items below graph minimum of 20
- 1 item above graph maximum of 38
|
Notes
This is the total number of letters a participant correctly identified before the test was concluded.
0 Related Data-Fields
There are no related data-fields