Data
109,917 items of data are available, covering 95,169 participants.
Defined-instances run from 2 to 3, labelled using Instancing
2.
Units of measurement are ms.
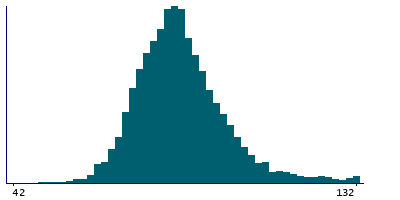
| Maximum | 356 |
| Decile 9 | 104 |
| Decile 8 | 96 |
| Decile 7 | 92 |
| Decile 6 | 88 |
| Median | 86 |
| Decile 4 | 84 |
| Decile 3 | 80 |
| Decile 2 | 78 |
| Decile 1 | 74 |
| Minimum | 4 |
|
|
- There are 94 distinct values.
- Mean = 88.0293
- Std.dev = 15.014
- 19 items below graph minimum of 44
- 2405 items above graph maximum of 134
|
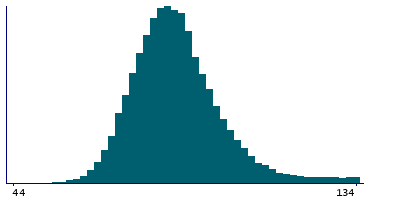
2 Instances
Instance 2 : Imaging visit (2014+)
92,339 participants, 92,339 items
| Maximum | 356 |
| Decile 9 | 104 |
| Decile 8 | 96 |
| Decile 7 | 92 |
| Decile 6 | 88 |
| Median | 86 |
| Decile 4 | 84 |
| Decile 3 | 80 |
| Decile 2 | 78 |
| Decile 1 | 74 |
| Minimum | 4 |
|
|
- There are 90 distinct values.
- Mean = 88.0795
- Std.dev = 14.9009
- 14 items below graph minimum of 44
- 1965 items above graph maximum of 134
|
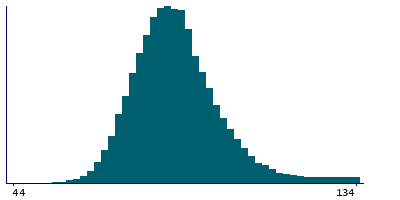
Instance 3 : First repeat imaging visit (2019+)
17,578 participants, 17,578 items
| Maximum | 236 |
| Decile 9 | 104 |
| Decile 8 | 96 |
| Decile 7 | 92 |
| Decile 6 | 88 |
| Median | 86 |
| Decile 4 | 82 |
| Decile 3 | 80 |
| Decile 2 | 76 |
| Decile 1 | 72 |
| Minimum | 4 |
|
|
- There are 78 distinct values.
- Mean = 87.7657
- Std.dev = 15.5919
- 5 items below graph minimum of 40
- 389 items above graph maximum of 136
|
Notes
QRS duration during ECG measurement
0 Related Data-Fields
There are no related data-fields