Data
82,605 items of data are available, covering 43,076 participants.
Defined-instances run from 2 to 3, labelled using Instancing
2.
Array indices run from 0 to 23.
Units of measurement are error-count.
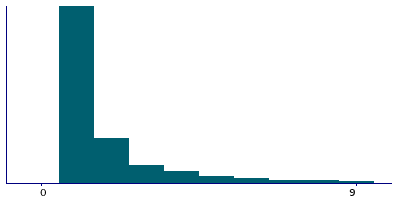
| Maximum | 621 |
| Decile 9 | 5 |
| Decile 8 | 3 |
| Decile 7 | 2 |
| Decile 6 | 1 |
| Median | 1 |
| Decile 4 | 1 |
| Decile 3 | 1 |
| Decile 2 | 1 |
| Decile 1 | 1 |
| Minimum | 1 |
|
|
- There are 78 distinct values.
- Mean = 2.59949
- Std.dev = 4.99082
- 3676 items above graph maximum of 9
|
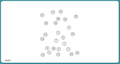
2 Instances
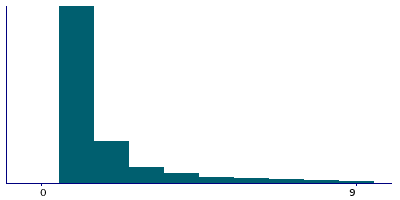
Instance 2 : Imaging visit (2014+)
37,159 participants, 66,866 items
| Maximum | 621 |
| Decile 9 | 5 |
| Decile 8 | 3 |
| Decile 7 | 2 |
| Decile 6 | 1 |
| Median | 1 |
| Decile 4 | 1 |
| Decile 3 | 1 |
| Decile 2 | 1 |
| Decile 1 | 1 |
| Minimum | 1 |
|

|
- There are 77 distinct values.
- Mean = 2.60705
- Std.dev = 5.15101
- 2970 items above graph maximum of 9
|
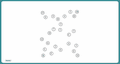
Instance 3 : First repeat imaging visit (2019+)
8,827 participants, 15,739 items
| Maximum | 96 |
| Decile 9 | 5 |
| Decile 8 | 3 |
| Decile 7 | 2 |
| Decile 6 | 1 |
| Median | 1 |
| Decile 4 | 1 |
| Decile 3 | 1 |
| Decile 2 | 1 |
| Decile 1 | 1 |
| Minimum | 1 |
|
|
- There are 49 distinct values.
- Mean = 2.56738
- Std.dev = 4.24323
- 706 items above graph maximum of 9
|
Notes
Errors before selecting a particular correct item in alphanumeric path (trail #2). Only values greater than zero are recorded.
It is possible that the value recorded here is less than the sum of the values in Field 6351 since this field does not count mistakes made on the latest circle when the trail timed-out before it was correctly selected.