Data
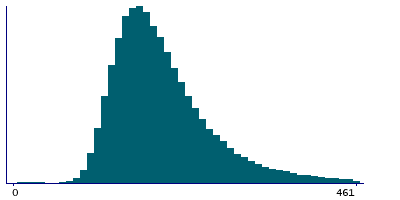
136,148 items of data are available, covering 131,987 participants.
Defined-instances run from 0 to 1, labelled using Instancing
2.
Units of measurement are seconds.
| Maximum | 1984 |
| Decile 9 | 296 |
| Decile 8 | 249 |
| Decile 7 | 223 |
| Decile 6 | 203 |
| Median | 188 |
| Decile 4 | 174 |
| Decile 3 | 161 |
| Decile 2 | 148 |
| Decile 1 | 131 |
| Minimum | 6 |
|

|
- There are 862 distinct values.
- Mean = 205.393
- Std.dev = 80.4394
- 1853 items above graph maximum of 461
|
2 Instances
Instance 0 : Initial assessment visit (2006-2010) at which participants were recruited and consent given
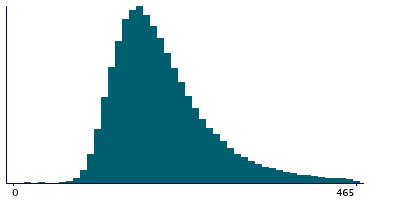
116,159 participants, 116,159 items
| Maximum | 1984 |
| Decile 9 | 300 |
| Decile 8 | 252 |
| Decile 7 | 225 |
| Decile 6 | 206 |
| Median | 190 |
| Decile 4 | 176 |
| Decile 3 | 163 |
| Decile 2 | 149 |
| Decile 1 | 133 |
| Minimum | 8 |
|

|
- There are 841 distinct values.
- Mean = 207.661
- Std.dev = 81.1312
- 1577 items above graph maximum of 467
|
Instance 1 : First repeat assessment visit (2012-13)
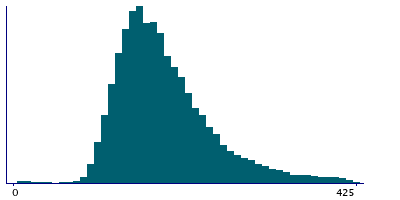
19,989 participants, 19,989 items
| Maximum | 1703 |
| Decile 9 | 275 |
| Decile 8 | 232 |
| Decile 7 | 208 |
| Decile 6 | 190 |
| Median | 176 |
| Decile 4 | 164 |
| Decile 3 | 152 |
| Decile 2 | 140 |
| Decile 1 | 125 |
| Minimum | 6 |
|

|
- There are 555 distinct values.
- Mean = 192.208
- Std.dev = 74.9478
- 284 items above graph maximum of 425
|


